I have written about NDepend a few times before and now that version 6 has been released this summer it’s time to mention it again, as I was given a licence for testing it by the kind NDepend guys 🙂
Trend monitoring
The latest version I have been using prior to version 6 is version 4, so my favorite new feature is the trend monitoring functionality (which was actually introduced in version 5). Such a great idea to integrate it into the client tool for experimenting! Normally you would define different metrics and let the build server store the history but having the possibility of working with this right inside of Visual Studio makes it so much easier to experiment with metrics without having to configure this in the build server.
Here is a screen shot of what it may look like (the project name is blurred so to not reveal the customer):
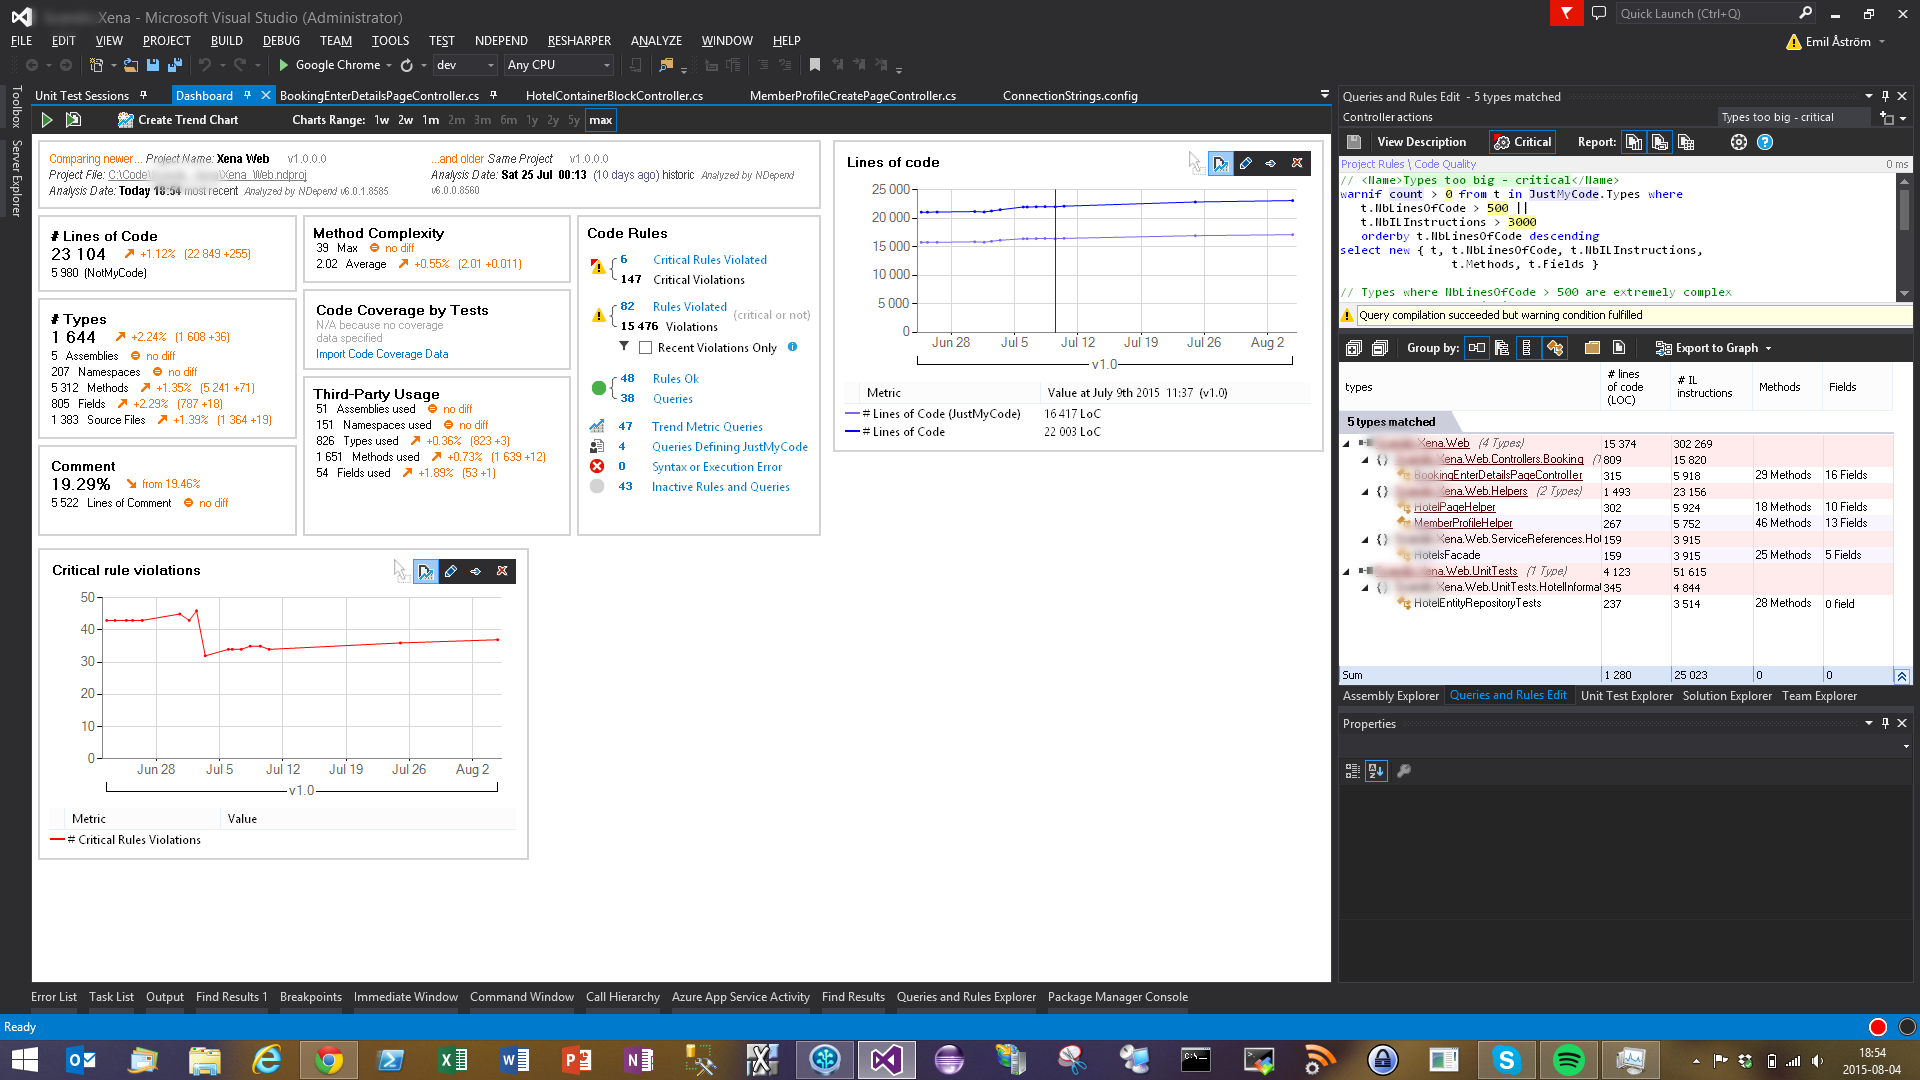
Dashboard with metrics and deltas compared to a given baseline plus two trend charts
- At the top of the dashboard there is information about the NDepend project that has been analyzed and the baseline analysis used for comparison.
- Below this there are several different groups with metrics and deltas, e.g. # Lines of Code (apparently the code base has grown with 1.12%, or 255 lines, in this case when compared to the baseline).
- Next to the numeric metrics are the trend charts, in my case just two of them, showing the number of lines of code and critical rule violations, respectively. Many more are available and it’s easy to create your own charts with custom metrics. BTW, “critical” refers to the rules deemed critical in this project. These rules will differ from project to project.
- In the image we can see that the number of lines of code grows steadily which is to be expected in a project which is actively developed.
- The number of critical errors also grows steadily which probably indicates an insufficient focus on code quality.
- There is a sudden decrease in rule violations in the beginning of July where one of the developers of the project decided to refactor some “smelly” code.
This is just a simple example but I’m really liking how easy it now is to get a feeling for the code trends of a project with just a glance on the dashboard every now and then.
The Dependency Matrix
The trend monitoring features may be very useful but the trademark feature of NDepend is probably the dependency matrix. Most people who have started up NDepend has probably seen the following rather bewildering matrix:
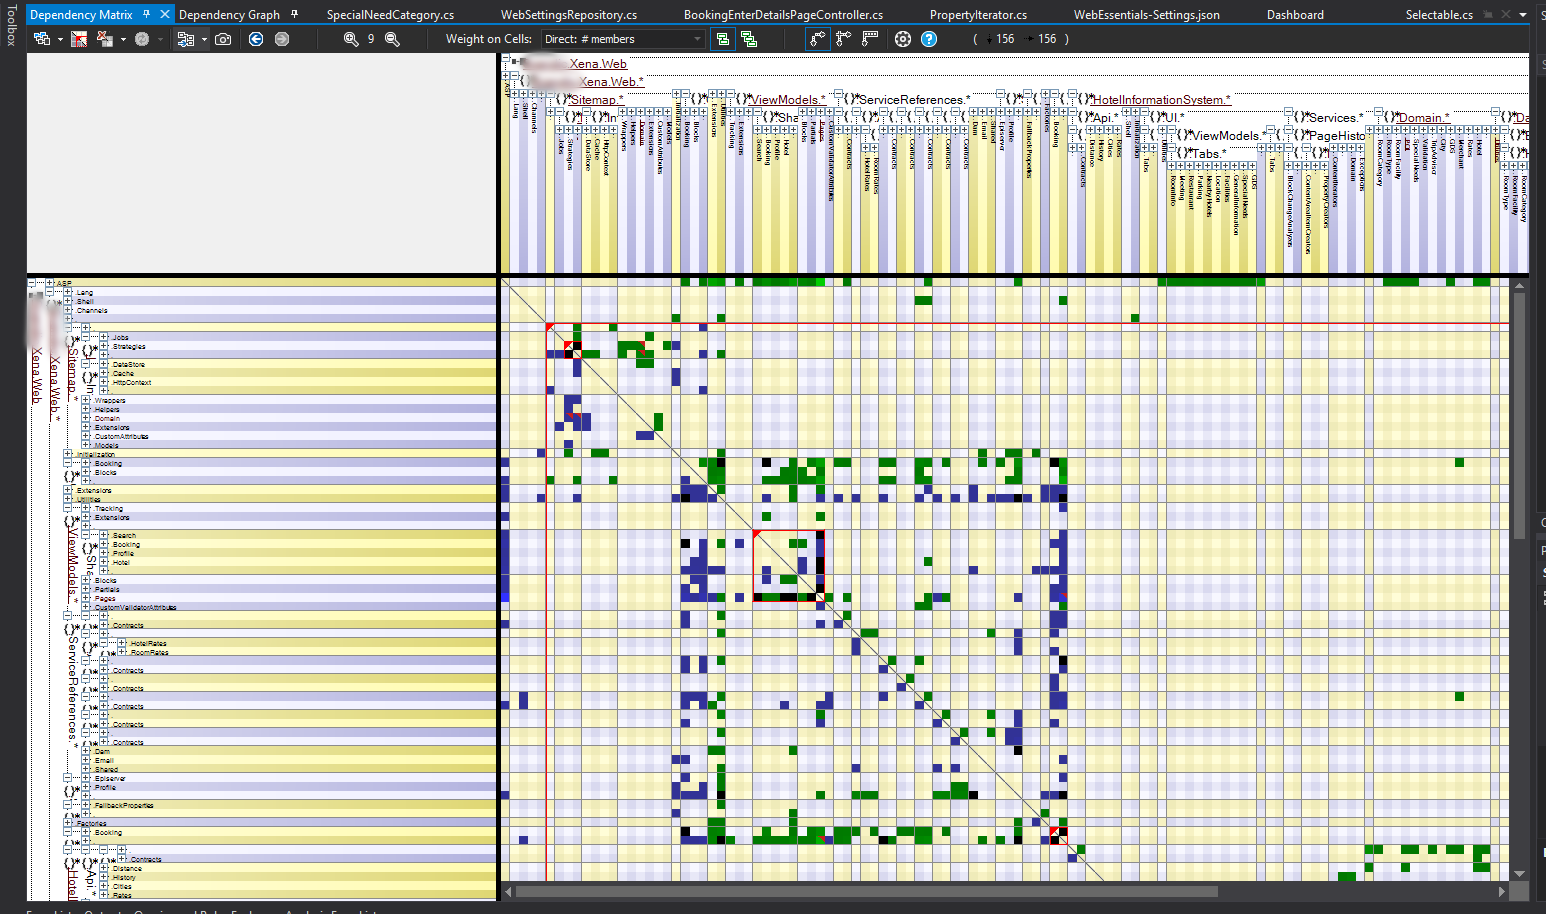
The dependency matrix can be used to discover all sorts of structual propertis of the code base
I must confess that I haven’t really spent too much time with this view before since I’ve had some problems grasping it fully, but this time around I decided it was time to dive into it a little more. I think it might be appropriate to write a few words on my findings, so here we go.
Since it’s a little difficult to see what’s going on with a non-trivial code base, I started with something trivial, with code in a main namespace referencing code in NamespaceA that in turn references code in NamespaceB. If the view does not show my namespaces (which is what I normally want, then the first thing to do when opening the matrix is to set the most suitable row/column filter with the dropdown):
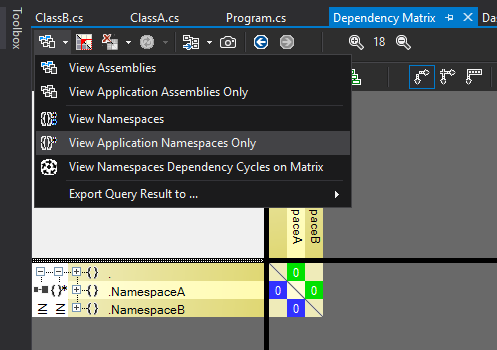
I tend to use View Application Namespaces Only most of the time since this filters out all third party namespaces and also expands all my application namespaces (the top level of the row/column headers are assemblies which is not normally what I want).
Also note that the calculation of the number shown inside a dependency cell can be changed independently of the filtering. In my case it’s 0 on all cells which seems strange since there are in fact dependencies, but the reason for this is that it shows the number of members used in the target namespace and in this case I only refer to types. Changing this is done in another dropdown in the matrix window.
Another thing I learned recently is that it may be very useful to switch back and forth between the Dependency Matrix and the Dependency Graph and in the image below I show both windows next to each other. In this simple case they show the same thing but when the code base grows then dependencies become too numerous to be shown visually in a useful way. Luckily there are options in the matrix to show parts of it the graph, and vice versa. For example, right clicking on namespace row heading opens a menu with a View Internal Dependencies On Graph option so that only a subset of the code base dependencies are shown. Very useful indeed.
Here’s what it may look like:
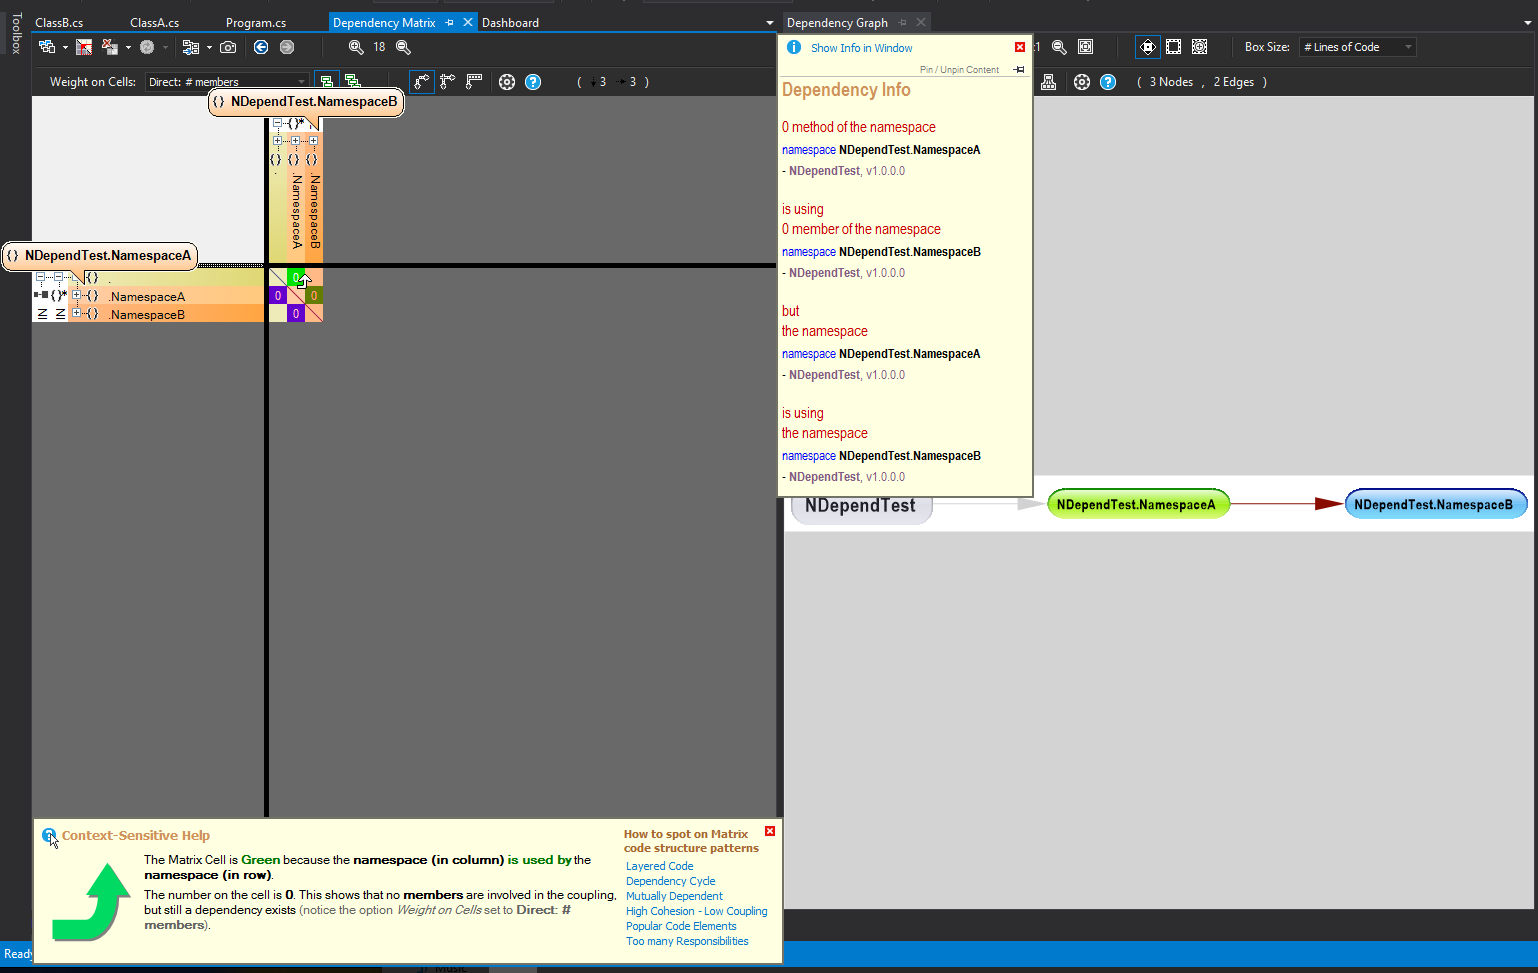
A simple sample project with just three namespaces
Also note that hovering over a dependency cell displays useful popups and changes the cursor into an arrow indicating the direction of the dependency, which is also reflected by the color of the cell (by the way, look out for black cells, they indicate circular references!)
Another way to invoke the graph is to right click a dependency cell in the matrix:
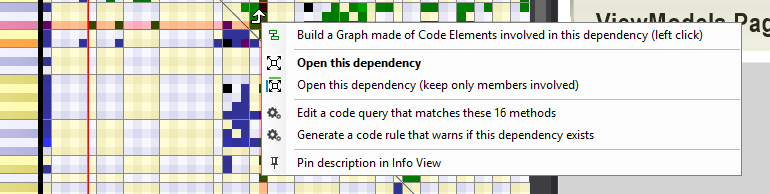
The top option, Build a Graph made of Code Elements involved in this dependency does just what is says. Also very useful.
By using the expand/collapse functionality of the dependency matrix together with the option to display dependencies in the graph view it becomes easier to pinpoint structual problems in the code base. It takes a bit of practise because of the sheer amount of information in the matrix but I’m growing into liking it more and more. I would suggest anyone interested to spend some time on this view and it’s many options. I found this official description to be useful for a newcomer: Dependency Structure Matrix
Wrapping it up
NDepend 6 has many more features than what I have described here and it’s such a useful tool that I would suggest anyone interested in code quality to download a trial and play around with it. Just be prepared to invest some time into learning the tool to get the most out of it.
A very good way to get started is the Pluralsight course by Eric Dietrich. It describes NDepend version 5 but all of it applies to version 6 as well and it covers the basics of the tool very well. Well worth a look if you’re a Pluralsight subscriber.