Creating ASP.Net Web API:s and generate clients with NSwag – Part 2

This is the second part of a two-post series about creating a Web API REST service written in ASP.Net Core and consuming it using the NSwag toolchain to automatically generate the C# client code.

The first part described how to set up the service and now it’s time to consume it by generating an API client using NSwag.

Note: We can use this method to consume any REST API that exposes a service description (i.e. a “swagger file”), we’re not at all limited to .Net Web API services.

Example code is available on GitHub.

Generating clients

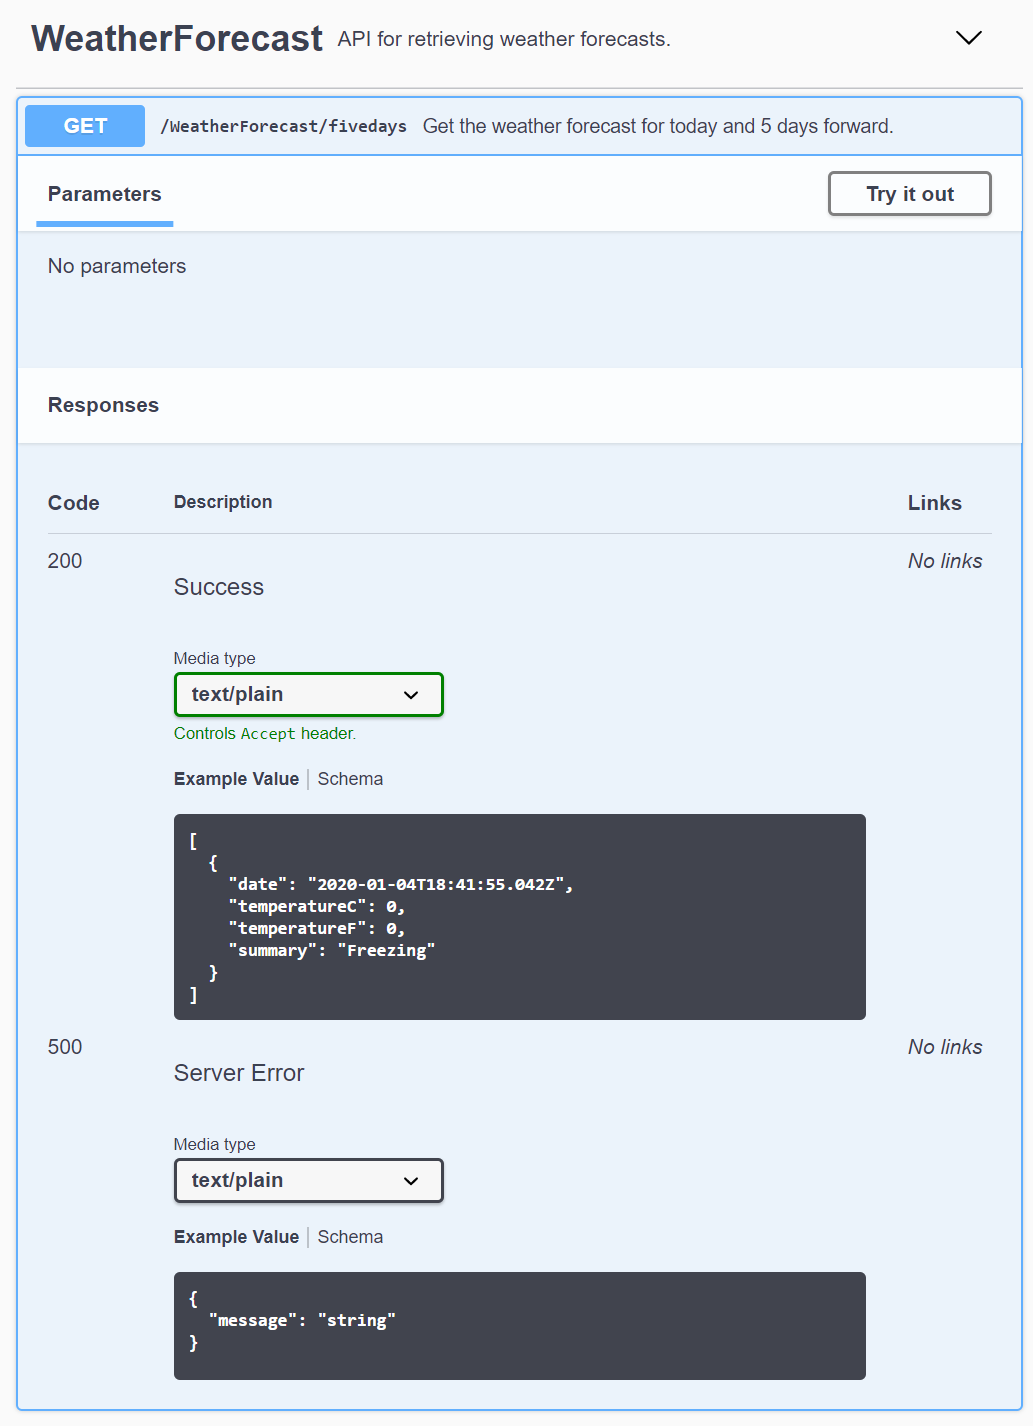
Once the service has a correct Swagger service description (the JSON file) we can start consuming the service by generating clients. There are several different tools for doing this and in this blog post I’ll use NSwag which is currently my favorite client generation tool as it’s very configurable and was built from the start for creating API clients for .Net.

NSwag has many options and can be used in two main ways:

  1. As a visual tool for Windows, called NSwagStudio
  2. As a command line tool, NSwag.exe, which is what I’ll describe here

NSwag.exe has many options so to make it easy to use it makes sense to create scripts that call the tool. The tool can also use saved definitions from NSwagStudio if that better suits your workflow, but I find it easier to just pass in all the options to NSwag.exe since it’s more transparent what settings are used.

Here’s how I currently use NSwag.exe to generate C# clients using a Powershell script:

function GenerateClient(
    $swaggerUrl,
    $apiNamespace,
    $apiName,
    $apiHelpersNamespace) {
    $apiHelpersNamespace = "${apiNamespace}.ApiHelpers"
    $clientFileName = "${apiName}Client.cs"
    $clientExtendedFileName = "${apiName}Client.Extended.cs"

    nswag openapi2csclient `
        "/Input:${swaggerUrl}" `
        "/Output:${clientFileName}" `
        "/Namespace:${apiNamespace}.${apiName}Api" `
        "/ClassName:${apiName}Client" `
        "/ClientBaseClass:${apiHelpersNamespace}.ApiClientBase" `
        "/GenerateClientInterfaces:true" `
        "/ConfigurationClass:${apiHelpersNamespace}.ApiConfiguration" `
        "/UseHttpClientCreationMethod:true" `
        "/InjectHttpClient:false" `
        "/UseHttpRequestMessageCreationMethod:false" `
        "/DateType:System.DateTime" `
        "/DateTimeType:System.DateTime" `
        "/GenerateExceptionClasses:false" `
        "/ExceptionClass:${apiHelpersNamespace}.ApiClientException"

    if ($LastExitCode) {
        write-host ""
        write-error "Client generation failed!"
    }
    else {
        write-host -foregroundcolor green "Updated API client: ${clientFileName}"

        if (-not (test-path $clientExtendedFileName)) {
            write-host ""
            write-host "Please create partial class '${clientExtendedFileName}' with overridden method to supply the service's base address:"
            write-host ""
            write-host -foregroundcolor yellow "`tprotected override Uri GetBaseAddress()"
            write-host ""
        }
    }
}

$apiName = 'Weather'
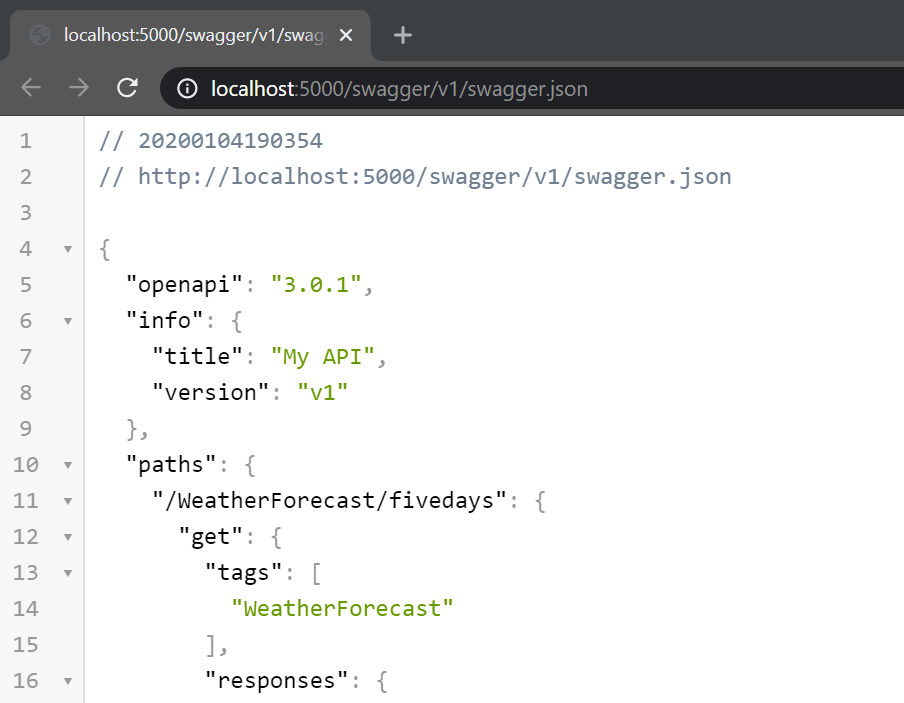
$swaggerUrl = 'http://localhost:5000/swagger/v1/swagger.json'
$apiNamespace = 'WebApiClientTestApp.Client'

GenerateClient $swaggerUrl $apiNamespace $apiName


I use the openapi2csclient generator (called swagger2csclient in previous NSwag versions) to create a C# class for calling the REST API, based on the swagger.json file for the service.  Except for some obvious options for input and out paths, and class name and namespace, some of these options need a few words of explanation.

  • /GenerateClientInterfaces is used to generate a C# interface so that the client class can easily be mocked when writing unit tests on classes that call the client.
  • /ClientBaseClass is the name of a base class that the generated client class will inherit from. This is useful for collecting common code that should be performed for more than one API client, such as authentication, configuration or error handling. Depending on other options, this base class is expected to contain some predefined methods (see here for more details). This is an example of what the base class might look like:
public abstract class ApiClientBase
{
    protected readonly ApiConfiguration Configuration;

    protected ApiClientBase(ApiConfiguration configuration)
    {
        Configuration = configuration;
    }

    // Overridden by api client partial classes to set the base api url. 
    protected abstract Uri GetBaseAddress();

    // Used if "/UseHttpClientCreationMethod:true /InjectHttpClient:false" when running nswag to generate api clients.
    protected async Task<HttpClient> CreateHttpClientAsync(CancellationToken cancellationToken)
    {
        var httpClient = new HttpClient {BaseAddress = GetBaseAddress()};
        return await Task.FromResult(httpClient);
    }
}

  • /ConfigurationClass is the name of a class used to pass configuration data into Api client.
  • /InjectHttpClient:false and /UseHttpClientCreationMethod:true are used to give the base class control of how the Http Client instance is created which can be useful for setting default headers, authentication etc.
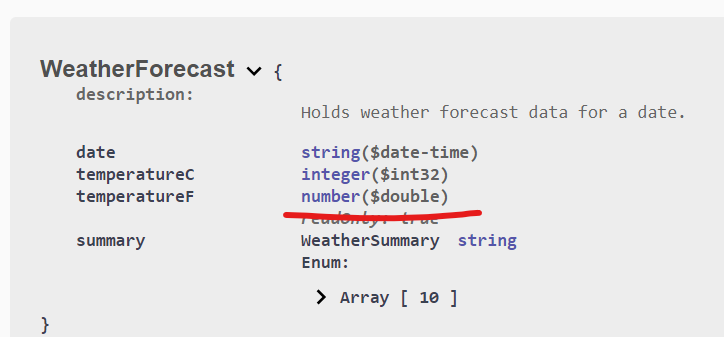
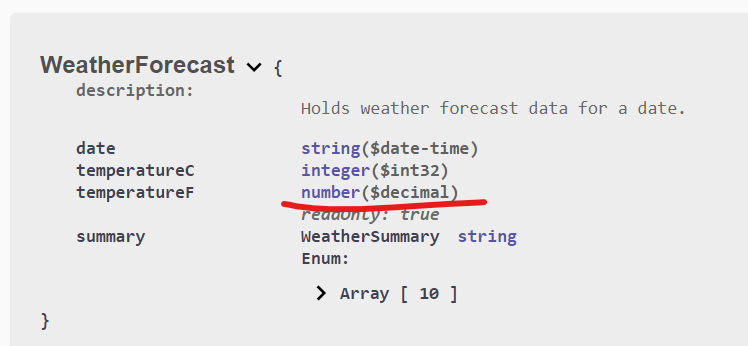
  • /DateType:System.DateTime and /DateTimeType:System.DateTime are used to create standard .Net DateTime types for dates rather than DateTimeOffset which NSwag for some reason seems to default to.
  • /GenerateExceptionClasses:false and /ExceptionClass are used to stop exception types from being generated for the APi client. The generated client will treat all 4xx and 5xx HTTP status codes on responses as errors and will throw an exception when it sees them. By using these options we can control the exception type so that all our generated API clients use the same exception type will greatly will simplify error handling.

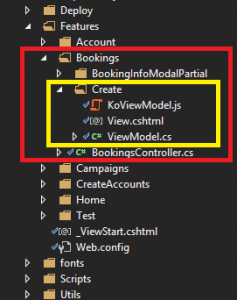
The generated C# client is marked as partial which allows us to manually create a small file for supplying information to the base class:

public partial class WeatherClient
{
  protected override Uri GetBaseAddress()
  {
    return new Uri(Configuration.WeatherApiBaseUrl);
  }
}

And that’s all we need to generate the clients with full control over the error handling, HTTP client creation. To generate the client, start the service and run the above script and the client C# class is automatically generated.

Test project

To test this out, get the example code from GitHub. The solution contains to projects:

  • WebApiClientTestApp.Api – a service with an example endpoint
  • WebApiClientTestApp.Client – a console app with a client that call the service

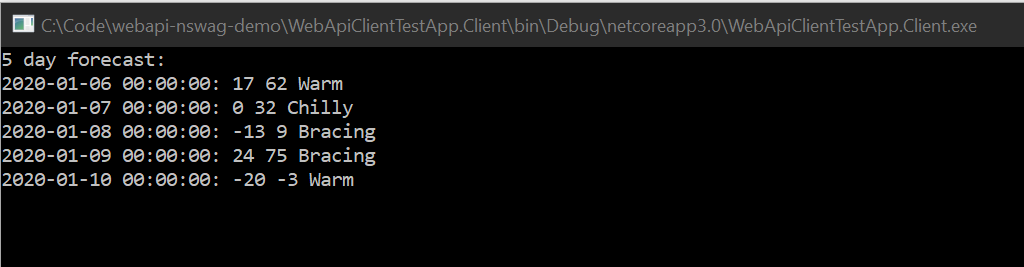
Starting first the Api project and then the Client project will print out the following in a command prompt:

Generating the client

To regenerate the client, first install NSwagStudio. Either the MSI installer or the Chocolatey installation method should be fine. Then start the Api project and open a Powershell prompt while the Api is running. Go to the Client project’s WeatherApi folder and type:

.\GenerateClient.ps1

The result should be something like this:

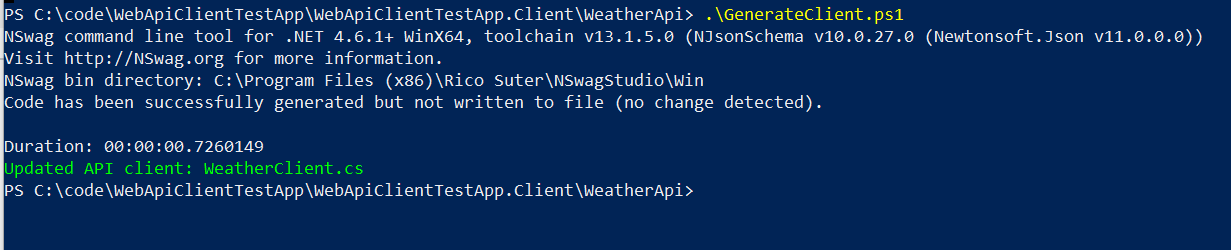
(If your output indicates an error you may have to run the Powershell as Administrator.)

The WeatherClient.cs file is now regenerated but unless the Api code is changed, the new version will be identical to the checked-in file. Try to delete it and regenerate it to see if it works.

The Powershell script can now be used every time the API is changed and the client needs to be updated.

Summary

By installing NSwagStudio and running the included console command nswag.exe, we are now able to generate an API client whenever we need to.

Note that the client generation described in this post is not limited to consuming .Net REST API:s, it can be used for any REST API that exposes service description files (swagger.json) properly, which makes this a very compelling pattern.

/Emil

Creating ASP.Net Web API:s and generate clients with NSwag – Part 1

This is the first part of a two-post series about creating a Web API REST service written in ASP.Net Core and consuming it using the NSwag toolchain to automatically generate the C# client code. This way of consuming a web service puts some requirements on the OpenAPI definition (previously known as Swagger definition) of the service so in this first part I’ll describe hot to properly set up a service so it can be consumed properly using NSwag.

The second part shows how to generate client code for the service.

Example code is available on GitHub.

Swashbuckle

When a new Web Api project (this post describes Asp.Net Core 3.0) is created in Visual Studio, it contains a working sample service but the code is missing a few crucial ingredients.

The most notable omission is that the service is missing an OpenAPI service description (also known as a Swagger description). On the .Net platform, such a service description is usually created automatically based on the API controllers and contracts using the Swashbuckle library.

This is how to install it and enable it in Asp.Net Core:

  1. Add a reference to the Swashbuckle.AspNetCore Nuget package (the example code uses version 5.0.0-rc5).
  2. Add the following to ConfigureServices(IServiceCollection services) in Startup.cs:
    services.AddSwaggerGen(c =>
      {
        c.SwaggerDoc("v1", new OpenApiInfo { Title = "My API", Version = "v1" });
      });
    
  3. Also add these lines to Configure(IApplicationBuilder app, IWebHostEnvironment env) in the same file:
    app.UseSwagger();
    app.UseSwaggerUI(c =>
      {
        c.SwaggerEndpoint($"/swagger/v1/swagger.json", ApiName);
      });
    

The first call enable the creation of the service description file and the second enables the UI for showing the endpoints with documentation and basic test functionality.

After starting the service, the description is available at this adress: /swagger/v1/swagger.json


More useful than this is the automatically created Swagger UI with documentation and basic endpoint testing features, found at /swagger:


Swashbuckle configuration

The service description is important for two reasons:

  1. It’s an always up-to-date documentation of the service
  2. It allows for generating API clients (data contracts and methods)

For both of these use cases it’s important that the service description is both complete and correct in the details. Swashbuckle does a reasonable job of creating a service description with default settings, but there are a few behaviors that need to be overridden to get the full client experience.

XML Comments

The endpoints and data contracts are not associated with any human-readable documentation and Swashbuckle has a feature that copies all XML comments from the code into the service description so that the documentation is much more complete.

To include the comments in the service description, the comments must first be saved to an XML file during project build, so that this file can be merged with the service description. This is done in the project settings:

After the path to the XML file to create is given in the XML documentation file field, Visual Studio will start to show warning CS1591 for public methods without an XML comment. This is most likely not the preferred behavior and the warning can be turned off by adding it to the Suppress warnings field as seen in the image above.

After the file is generated then it can be referenced by Swashbuckle in the Swagger setup by using the IncludeXmlComments option. This is an example of how to compose the path to the XML file and supply it to Swashbuckle inside ConfigureServices:

            services.AddSwaggerGen(c =>
            {
                c.SwaggerDoc("v1", new OpenApiInfo { Title = "My API", Version = "v1" });

                // Set the comments path for the Swagger JSON and UI.
                var xmlFile = $"{Assembly.GetExecutingAssembly().GetName().Name}.xml";
                var xmlPath = Path.Combine(_baseFolder, xmlFile);
                c.IncludeXmlComments(xmlPath, includeControllerXmlComments: true);
            });

The field _baseFolder is set like this in the Configure method:

        public void Configure(IApplicationBuilder app, IWebHostEnvironment env)
        {
            _baseFolder = env.ContentRootPath;
            ...
        }

The result should look like this:


Override data types

Some data types are not correctly preserved in the service description by default, for example the decimal type found in .Net, which is commonly used in financial applications. This can be fixed by overriding the behavior for those particular types.

This is how to set the options to serialize decimal values correctly in the call to AddSwaggerGen:

                // Mark decimal properties with the "decimal" format so client contracts can be correctly generated.
                c.MapType<decimal>(() => new OpenApiSchema { Type = "number", Format = "decimal" });
                c.MapType<decimal>(() => new OpenApiSchema { Type = "number", Format = "decimal" });

(This fix is from the discussion about a bug report for Swashbuckle.)

Before:

After:


Other service adjustments

In addition to adding and configuring Swashbuckle, there are a couple of other adjustments I like to make when creating services.

Serializing enums as strings

Enums are very useful in .Net when representing a limited number of values such as states, options, modes and similar. In .Net, enum values are normally just disguised integers which is evident in Web Api responses containing enum values, since they are returned as integers with unclear interpretation. Returning integers is not that descriptive so I typically configure my services to return enum values as strings. This is easiest done by setting an option for the API controllers in the ConfigureServices method in the Startup class:

services.AddControllers()
  .AddJsonOptions(options =>
    {
        // Serialize enums as string to be more readable and decrease
        // the risk of incorrect conversion of values.
        options.JsonSerializerOptions.Converters.Add(
            new JsonStringEnumConverter());
        });


Serializing dates as strings without time parts

In the .Net framework there is no data type for dates, so we’re normally relying on the good old DateTime also in cases where the time is irrelevant. This also means that API responses with dates often will contain time parts:

{
    "date": "2020-01-06T00:00:00+01:00",
    "temperatureC": 49,
    "temperatureF": 120,
    "summary": "Warm"
},

This is confusing and may lead to bugs because of the time zone specification part.

To fix this, we can create a Json serializer that extract the date from the DateTime value as described in this StackOverflow discussion.

public class ShortDateConverter : JsonConverter&lt;DateTime&gt;
{
  public override DateTime Read(ref Utf8JsonReader reader, Type typeToConvert, JsonSerializerOptions options)
  {
    return DateTime.Parse(reader.GetString());
  }

  public override void Write(Utf8JsonWriter writer, DateTime value, JsonSerializerOptions options)
  {
    writer.WriteStringValue(value.ToUniversalTime().ToString("yyyy-MM-dd"));
  }
}

The serializer must then be applied on the data contract properties as required:

public class WeatherForecast
{
  [JsonConverter(typeof(ShortDateConverter))]
  public DateTime Date { get; set; }
}

This is the result:

{
    "date": "2020-01-06",
    "temperatureC": 49,
    "temperatureF": 120,
    "summary": "Warm"
},

Much better. 🙂

Returning errors in a separate response type

In case of an error, information about it should be returned in a structured way just as any other content. I sometimes see added fields in the normal response types for error messages and similar but I think this is bad practice since it pullutes the data contracts with (generally) unused properties. It’s much clearer for the client if there is a specific data contract for returning errors, for example something like this:

{
  "errorMessage": "An unhandled error occurred."
}

Having separate contracts for normal responses and errors requires controller actions to return different types of values depending on whether there’s an error or not, and that the Swagger service description displays information about all the required types. Luckily Swashbuckle supports this well, as long as the return types are described using the ProducesResponseType attribute.

Here’s a complete controller action where we return different classes depending on if there’s an error or not:

        [HttpGet]
        [Route("fivedays")]
        [ProducesResponseType(
          statusCode: (int)HttpStatusCode.OK,
          type: typeof(IEnumerable<WeatherForecast>))]
        [ProducesResponseType(
          statusCode: (int)HttpStatusCode.InternalServerError,
          type: typeof(ApiError))]
        public ActionResult<IEnumerable<WeatherForecast>> Get()
        {
            try
            {
                var rng = new Random();
                return Enumerable.Range(1, 5)
                    .Select(index =&amp;amp;amp;amp;amp;gt; new WeatherForecast
                    {
                        Date = DateTime.Now.AddDays(index),
                        TemperatureC = rng.Next(-20, 55),
                        Summary = GetRandomSummary(rng)
                    }).ToArray();
            }
            catch (Exception ex)
            {
                _logger.LogError(ex, "Unhandled error");
                return StatusCode(
                    (int)HttpStatusCode.InternalServerError,
                    new ApiError { Message = "Server error" });
            }
        }

The Swagger page correctly displays the different data structures used for the different status codes:


Summary

This concludes the first part in this mini-series. We now have a complete Web Api service with the following properties:

  • A Swagger description file can be found at /swagger/v1/swagger.json
  • A Swagger documentation and testing page can be found at /swagger
  • Code comments are included in the service description
  • Enums are serialized as strings
  • Dates are serializes as short dates, without time part
  • Decimal values are correctly describes in the service description

In part 2 we show how we can consume this service in a client.

/Emil


Generating semantic version build numbers in Teamcity

Background

This is what we want to achieve, build numbers with minor, major and build counter parts together with the branch name.

This is what we want to achieve, build numbers with minor, major and build counter parts together with the branch name.

What is a good version number? That depends on who you ask I suppose, but one of the most popular versioning schemes is semantic versioning. A version number following that scheme can look like the following:

1.2.34-beta

In this post I will show how an implementation for generating this type of version numbers in Teamcity with the following key aspects:

  1. The major and minor version numbers (“1” and “2” in the example above) will be coming for the AssemblyInfo.cs file.
    • It is important that these numbers come from files in the VCS repository (I’m using Git) where the source code is stored so that different VCS branches can have different version numbers.
  2. The third group (“34”) is the build counter in Teamcity and is used to separate different builds with the same major and minor versions from each other.
  3. The last part is the pre-release version tag and we use the branch name from the Git repository for this.
    • We will apply some filtering and formatting for our final version since the branch name may contain unsuitable characters.

In the implementation I’m using a Teamcity feature called File Content Replacer which was introduced in Teamcity 9.1. Before this we we had to use another feature called Assembly Info Patcher but that method had several disadvantages, mainly that there was no easy way of using the generated version number in other build steps.

In the solution described below, we will replace the default Teamcity build number (which is equal to the build counter) with a custom one following the version outlined above. This makes it possible to reuse the version number everywhere, e.g. in file names, Octopus Release names, etc. This is a great advantage since it helps make connect everything produced in a build chain together (assemblies, deployments,  build monitors, etc).

Solution outline

The steps involved to achieve this are the following:

  1. Assert that the VCS root used is properly configured
  2. Use the File Content Replacer to update AssemblyInfo.cs
  3. Use a custom build step with a Powershell script to extract the generated version number from AssemblyInfo.cs, format it if needed, and then tell Teamcity to use this as the build number rather than the default one
  4. After the build is complete, we use the VCS Labeling build feature to add a build number tag into the VCS

VCS root

The first step is to make sure we get proper branch names when we use the Teamcity %teamcity.build.branch% variable. This will contain the branch name from the version control system (Git in our case) but there is a special detail worth mentioning, namely that the branch specification’s wildcard part should be surrounded with parentheses:

VCS root branch specification with parenthesis.

VCS root branch specification with parenthesis.

If we don’t do this, then the default branch (“develop” in this example) will be shown as <default> which is not what we want. The default branch should be the name branch name just like every other branch, and adding the parentheses ensures that.

Updating AssemblyInfo.cs using the File Content Replacer build feature

In order for the generated assembly to have the correct version number we update the AssemblyInfo.cs before building it. We want to update the following two lines:


[assembly: AssemblyVersion("1.2.0.0")]
[assembly: AssemblyFileVersion("1.2.0.0")]

The AssemblyVersion attribute is used to generate the File version property of the file and the AssemblyFileVersion attribute is used for the Product version.

File version and product version of the assembly.

File version and product version of the assembly.

We keep the first two integers to use them as major and minor versions in the version number. Note that the AssemblyVersion attribute has restriction on it so that it must be four integers separated by dots, while AssemblyFileVersion does not have this restriction and can contain our branch name as well.

To accomplish the update, we use the File Content Replacer build feature in Teamcity two times (one for each attribute) with the following settings:

AssemblyVersion

  • Find what:
    (^\s*\[\s*assembly\s*:\s*((System\s*\.)?\s*Reflection\s*\.)?\s*AssemblyVersion(Attribute)?\(")([0-9\*]+\.[0-9\*]+\.)([0-9\*]+\.[0-9\*]+)("\)\])$
  • Replace with:
    $1$5\%build.counter%$7

AssemblyFileVersion

  • Find what:
    (^\s*\[\s*assembly\s*:\s*((System\s*\.)?\s*Reflection\s*\.)?\s*AssemblyFileVersion(Attribute)?\(")([0-9\*]+\.[0-9\*]+\.)([0-9\*]+\.[0-9\*]+)("\)\])$
  • Replace with:
    $1$5\%build.counter%-%teamcity.build.branch%$7

As you can see, the “Find what” parts are regular expressions that finds the part of AssemblyInfo.cs that we want to update and “Replace with” are replacement expressions in which we can reference the matching groups of the regex and also use Teamcity variables. The latter is used to insert the Teamcity build counter and the branch name.

In our case we keep the first two numbers but if the patch number (the third integer) should also be included, then these two expressions can be adjusted to accomodate for this.

The FIle Content Replacer build feature in Teamcity.

The FIle Content Replacer build feature in Teamcity.

When we have done the above, the build will produce an assembly with proper version numbers, similarly to what we could accomplish with the old Assembly Info Patcher, but the difference with the old method is that we now have an patched AssemblyInfo.cs file whereas with the old method it was unchanged as only the generated assembly DLL file was patched. This allows us to extract the generated version number in the next step.

Setting the Teamcity build number

Up to now, the Teamcity build number has been unchanged from the default of being equal to the build counter (a single integer, increased after every build). The format of the build number is set in the General Settings tab of the build configuration.

The General Settings tab for a build configuration.

The General Settings tab for a build configuration.

The build number is just a string uniquely identifying a build and it’s displayed in the Teamcity build pages and everywhere else where builds are displayed, so it would be useful to include our full version number in it. Doing that also makes it easy to use the version number in other build steps and configurations since the build number is always accessible with the Teamcity variable %system.build.number%.

To update the Teamcity build number, we rely on a Teamcity service message for setting the build number. The only thing we have to do is to make sure that our build process outputs a string like the following to the standard output stream:

##teamcity[buildNumber '1.2.34-beta']

When Teamcity sees this string, it will update the build number with the supplied new value.

To output this string, we’re using a separate Powershell script build step that extracts the version string from the AssemblyInfo.cs file and does some filtering and truncates it. The latter is not strictly necessary but in our case we want the build number to be usable as the name of a release in Octopus Deploy so we format it to be correct in that regard, and truncate it if it grows beyond 20 characters in length.

Build step for setting the Teamcity build number

Build step for setting the Teamcity build number

The actual script looks like this (%MainAssemblyInfoFilePath% is a variable pointing to the relative location of the AssemblyInfo.cs file):

function TruncateString([string] $s, [int] $maxLength)
{
	return $s.substring(0, [System.Math]::Min($maxLength, $s.Length))
}

# Fetch AssemblyFileVersion from AssemblyInfo.cs for use as the base for the build number. Example of what
# we can expect: "1.1.82.88-releases/v1.1"
# We need to filter out some invalid characters and possibly truncate the result and then we're good to go.  
$info = (Get-Content %MainAssemblyInfoFilePath%)

Write-Host $info

$matches = ([regex]'AssemblyFileVersion\(\"([^\"]+)\"\)').Matches($info)
$newBuildNumber = $matches[0].Groups[1].Value

# Split in two parts:  "1.1.82.88" and "releases/v1.1"
$newBuildNumber -match '^([^-]*)-(.*)$'
$baseNumber = $Matches[1]
$branch = $Matches[2]

# Remove "parent" folders from branch name.
# Example "1.0.119-bug/XENA-5834" =&amp;amp;amp;gt; "1.0.119-XENA-5834"
$branch = ($branch -replace '^([^/]+/)*(.+)$','$2' )

# Filter out illegal characters, replace with '-'
$branch = ($branch -replace '[/\\ _\.]','-')

$newBuildNumber = "$baseNumber-$branch"

# Limit build number to 20 characters to make it work with Octopack
$newBuildNumber = (TruncateString $newBuildNumber 20)

Write-Host "##teamcity[buildNumber '$newBuildNumber']"

(The script is based on a script in a blog post by the Octopus team.)

When starting a new build with this build step in it, the build number will at first be the one set in the General Settings tab, but when Teamcity sees the output service message, it will be updated to our version number pattern. Pretty nifty.

Using the Teamcity build numbers

To wrap this post up, here’s an example of how to use the updated build number to create an Octopus release.

Creating an Octopus release with proper version number from within Teamcity.

Creating an Octopus release with proper version number from within Teamcity.


In Octopus, the releases will now have the same names as the build numbers in Teamcity, making it easy to know what code is part of the different releases.

The releases show up in Octopus with the same names as the build number in Teamcity.

The releases show up in Octopus with the same names as the build number in Teamcity.

Tagging the VCS repository with the build number

The final step for adding full tracability to our build pipeline is to make sure that successful builds adds a tag to the last commit included in the build. This makes it easy in the VCS to know exactly what code is part of a given version, all the way out to deployed Octopus releases. This is very easy to accomplish using the Teamcity VCS labeling build feature. Just add it to the build configuration with values like in the image below, and tags will created automatically everytime a build succeeds.

The VCS Labeling build feature in Teamcity.

The VCS Labeling build feature in Teamcity.

The tags show up in Git like this:

Tags in the Git repository connects the versions of successful builds with the commit included in the build.

Tags in the Git repository connects the versions of successful builds with the commits included in the build.

Mission accomplished.

/Emil

Debugging a memory leak in an ASP.Net MVC application

Background

We recently had a nasty memory leak after deploying a new version of a project I’m involved in. The new version contained 4 months of changes compared to the previous version and because so many things had changed it was not obvious what caused the problem. We tried to go through all the changes using code compare tools (Code Compare is a good one) but could not find anything suspicious. It took us about a week to finally track down the problem and in this post I’ll write down a few tips that we found helpful. The next time I’m having a difficult memory problem I know where to look, and even if this post is a bit unstructured I hope it contains something useful for other people as well.

.Net memory vs native memory

The first few days we were convinced that we had made a logical error or had made some mistakes in I/O access. We also suspected that our caching solutions had gone bad, but it was hard to be sure. We used Dynatrace to get .Net memory dumps from other environments than our production environment which has zero downtime requirements. We also used a memory profiler (dotMemory) to see if we could see any trends in memory usage one local dev machines with a crawler running, but nothing conclusive could be found.

Then we got a tip to have a look at a few Windows performance counters that can help track down this kind of problem:

  1. Process / Private Bytes – the total memory a process has allocated (.Net and native combined)
  2. .NET CLR Memory / # Bytes in all Heaps – the memory allocated for .Net objects

We added these two for our IIS application pool process (w3p.exe) and it turned out that the total memory allocations increased but that the .Net memory heap did not:

Perf counter #1

Total memory usage (red line) is increasing but the .Net memory heap allocations (blue) are not.

This means that it’s native memory that gets leaked and we could rule out our caching and other .Net object allocations.

What is allocated?

So we now knew it was native memory that was consumed, but not what kind of memory.

One classic type of memory leak is to not release files and other I/O objects properly and we got another tip for how to check for that, namely to add the Process / Handle Count performance counter. Handles are small objects used to reference different types of Windows objects, such as files, registry items, window items, threads, etc, etc, so it’s useful to see if that number increases. And it did:

The handle count (green) followed the increase memory usage very closely.

The handle count (green) followed the increased memory usage very closely.

By clicking on a counter in the legend we could see that the number of active handles increased to completely absurd levels, a few hours after an app pool recycle we had 2-300 000 active handles which definitely indicates a serious problem.

What type of handles are created?

The next step was to try to decide what type of handles were created. We suspected some network problem but were not sure. We then find out about this little gem of a tool: Sysinternals Handle. It’s a command line tool that can list all active handles in a process and to function properly it must be executed with administrative privileges (i.e. start the Powershell console with “Run as Administrator”). It also has a handy option to summarize the number of handles of each type which we used like this:

PS C:\utils\Handle> .\Handle.exe -p 13724 -s

Handle v4.0
Copyright (C) 1997-2014 Mark Russinovich
Sysinternals - www.sysinternals.com

Handle type summary:
  ALPC Port       : 8
  Desktop         : 1
  Directory       : 5
  EtwRegistration : 158
  Event           : 14440
  File            : 226
  IoCompletion    : 8
  IRTimer         : 6
  Job             : 1
  Key             : 96
  Mutant          : 59
  Section         : 258
  Semaphore       : 14029
  Thread          : 80
  Timer           : 1
  Token           : 5
  TpWorkerFactory : 3
  WaitCompletionPacket: 15
  WindowStation   : 2
Total handles: 29401

It was obvious that we had a problem with handles of the Event and Semaphore types. To focus on just those two when experimenting we used simple PowerShell string filtering to make these two stand out better:

PS C:\utils\Handle> .\Handle.exe -p 13724 -s | select-string "event|semaphore"

  Event           : 14422
  Semaphore       : 14029

At this point we had a look again at the code changes made during the 4 months but could still not see what could be causing the problems. There was a new XML file that was accesses but that code used an existing code pattern we had and since we were looking at Event and Semaphore handles it did not seem related.

Non-suspending memory dumps

After a while someone suggested using Sysinternals Procdump to get a memory dump from the production environment without suspending the process being dumped (which happens when using the Create dump file option in Task Manager) using a command line like this:


PS C:\Utils\Procdump> .\procdump64.exe -ma 13724 -r

ProcDump v8.0 - Writes process dump files
Copyright (C) 2009-2016 Mark Russinovich
Sysinternals - www.sysinternals.com
With contributions from Andrew Richards

[00:31:19] Dump 1 initiated: C:\Utils\Procdump\iisexpress.exe_160619_003119.dmp
[00:31:20] Waiting for dump to complete...
[00:31:20] Dump 1 writing: Estimated dump file size is 964 MB.
[00:31:24] Dump 1 complete: 967 MB written in 4.4 seconds
[00:31:24] Dump count reached.


The -r option results in that a clone of the process being dumped is created so that the dump can be taken without bringing the site to a halt. We monitored the number of requests per second during the dump file creation using the ASP.NET Applications / Requests/Sec performance counter and it was not affected at all.

Now that we had a dump file, we analyzed it in the Debug Diagnostic Tool v2 from Microsoft. We used the MemoryAnalysis option and loaded the previously created dump under Data Files:

Using the memory analysis function on a dump file.

Using the memory analysis function on a dump file.

The report showed a warning about the finalize queue being very long but that did not explain very much to us, except that something was wrong with deallocating some types of objects.

Debug Diagnostic Tool report

Debug Diagnostic Tool report

There was just one warning after the memory analysis of the dump, that there were a lot of object that were not finalized.

The report also contained a section about the type of object in the finalize queue:

The finalizer queue in the Debug Diagnostic Tool report

The finalizer queue in the Debug Diagnostic Tool report

The most frequent type of object in the queue is undeniably related to our Event and Semaphore handles.

The solution

The next day, one of the developers thought again about what we had changed in the code with regards to handles and again landed on the code that opened an XML file. The code looked like this:

private static IEnumerable<Country> GetLanguageList(string fileFullPath)
{
    List<Country> languages;
    var serializer = new XmlSerializer(typeof(List<Country>),
        new XmlRootAttribute("CodeList"));
    using (var reader = XmlReader.Create(fileFullPath))
    {
        languages = (List<Country>)serializer.Deserialize(reader);
        foreach (var c in languages)
            c.CountryName = c.CountryName.TrimStart().TrimEnd();
    }
    return languages;
}

It looks pretty innocent but he decided to Google “XmlSerializer memory leak”, and what do you know, the first match is a blog post by Tess Fernandez called .NET Memory Leak: XmlSerializing your way to a Memory Leak… It turns out that there is an age-old bug (there is no other way of classifying this behavior) in XmlSerializer that it will not return all memory when deallocated, for some of its constructors. This is even documented by Microsoft themselves in the docs for the XmlSerializer class, under the Dynamically Generated Assemblies heading it says:

If you use any of the other constructors, multiple versions of the same assembly are generated and never unloaded, which results in a memory leak and poor performance.

Yes, indeed it does… Since .Net Framework 1.1, it seems. It turns out we should not create new instances of the XmlSerializer class, but cache and reuse them instead. So we implemented a small cache class that handles the allocation and caching of these instances:

using System.Collections.Concurrent;
using System.Xml.Serialization;

namespace Xena.Web.Services
{
    public interface IXmlSerializerFactory
    {
        XmlSerializer GetXmlSerializer<T>(string rootAttribute);
    }

    public class XmlSerializerFactory : IXmlSerializerFactory
    {
        private readonly ConcurrentDictionary<string, XmlSerializer> _xmlSerializerCache;

        public XmlSerializerFactory()
        {
            _xmlSerializerCache = new ConcurrentDictionary<string, XmlSerializer>();
        }

        public XmlSerializer GetXmlSerializer<T>(string rootAttribute)
        {
            var key = typeof(T).FullName + "#" + rootAttribute;

            var serializer = _xmlSerializerCache.GetOrAdd(key,
                k => new XmlSerializer(typeof (T), new XmlRootAttribute(rootAttribute)));

            return serializer;
        }
    }
}

This class has to be a singleton, of course, which was configured in our DI container StructureMap like this:

container.Configure(c => c.For(typeof(IXmlSerializerFactory)).Singleton().Use(typeof(XmlSerializerFactory)));

And finally, everything worked like a charm, with horizontal memory graphs. 🙂

Using handle.exe it was easy to verify on the developer machines that the XmlSerializerFactory actually solved the problem since the Semaphore handle count now remained constant after page views. If we only had had the memory graphs to go by, it would have taken much longer to verify the non-growing memory trend since the total memory allocations always fluctuates during execution.

/Emil

Analyzing battery health on a Windows PC

Recently, my wife’s laptop has started to exhibit shorter and shorter battery life after each full load so I suspected that it was time for exchanging the battery. But how can one be sure that replacing the battery solves the problem? Laptop batteries are not exactly cheap, the one I found for the wife’s Asus A53S costs about 50 €.

It turns out that there’s a useful command line tool built into Windows for this: powercfg.exe

PS C:\WINDOWS\system32> powercfg.exe -energy
Enabling tracing for 60 seconds...
Observing system behavior...
Analyzing trace data...
Analysis complete.

Energy efficiency problems were found.

14 Errors
17 Warnings
24 Informational

See C:\WINDOWS\system32\energy-report.html for more details.
PS C:\WINDOWS\system32> start C:\WINDOWS\system32\energy-report.html

A lot of errors and warnings, apparently. Viewing the generated file reveals the details, and apart from the errors and warnings (that were mostly related to energy savings not being enabled when running on battery) there was this interesting tidbit of information:

powercfg_output

This is in obviously in Swedish, in English the labels would be Design Capacity 56160 and Last Full Charge 28685, so it seems that the battery cannot be loaded to its full capacity anymore, but rather about half of it. Seem it’s indeed time for a new battery.

/Emil

(I wrote this post to remind myself of this useful utility. I did by the way buy a new battery and now battery life is back to normal.)


NDepend v6

I have written about NDepend a few times before and now that version 6 has been released this summer it’s time to mention it again, as I was given a licence for testing it by the kind NDepend guys 🙂

Trend monitoring

The latest version I have been using prior to version 6 is version 4, so my favorite new feature is the trend monitoring functionality (which was actually introduced in version 5). Such a great idea to integrate it into the client tool for experimenting! Normally you would define different metrics and let the build server store the history but having the possibility of working with this right inside of Visual Studio makes it so much easier to experiment with metrics without having to configure this in the build server.

Here is a screen shot of what it may look like (the project name is blurred so to not reveal the customer):

Dashboard with metrics and deltas compared to a given baseline plus two trend charts

Dashboard with metrics and deltas compared to a given baseline plus two trend charts

  • At the top of the dashboard there is information about the NDepend project that has been analyzed and the baseline analysis used for comparison.
  • Below this there are several different groups with metrics and deltas, e.g. # Lines of Code (apparently the code base has grown with 1.12%, or 255 lines, in this case when compared to the baseline).
  • Next to the numeric metrics are the trend charts, in my case just two of them, showing the number of lines of code and critical rule violations, respectively. Many more are available and it’s easy to create your own charts with custom metrics. BTW, “critical” refers to the rules deemed critical in this project. These rules will differ from project to project.
    • In the image we can see that the number of lines of code grows steadily which is to be expected in a project which is actively developed.
    • The number of critical errors also grows steadily which probably indicates an insufficient focus on code quality.
    • There is a sudden decrease in rule violations in the beginning of July where one of the developers of the project decided to refactor some “smelly” code.

This is just a simple example but I’m really liking how easy it now is to get a feeling for the code trends of a project with just a glance on the dashboard every now and then.

The Dependency Matrix

The trend monitoring features may be very useful but the trademark feature of NDepend is probably the dependency matrix. Most people who have started up NDepend has probably seen the following rather bewildering matrix:

The dependency matrix can be used to discover all sorts of structual propertis of the code base

The dependency matrix can be used to discover all sorts of structual propertis of the code base

I must confess that I haven’t really spent too much time with this view before since I’ve had some problems grasping it fully, but this time around I decided it was time to dive into it a little more. I think it might be appropriate to write a few words on my findings, so here we go.

Since it’s a little difficult to see what’s going on with a non-trivial code base, I started with something trivial, with code in a main namespace referencing code in NamespaceA that in turn references code in NamespaceB. If the view does not show my namespaces (which is what I normally want, then the first thing to do when opening the matrix is to set the most suitable row/column filter with the dropdown):

The dependency matrix filtering dropdown

I tend to use View Application Namespaces Only most of the time since this filters out all third party namespaces and also expands all my application namespaces (the top level of the row/column headers are assemblies which is not normally what I want).

Also note that the calculation of the number shown inside a dependency cell can be changed independently of the filtering. In my case it’s 0 on all cells which seems strange since there are in fact dependencies, but the reason for this is that it shows the number of members used in the target namespace and in this case I only refer to types. Changing this is done in another dropdown in the matrix window.

Another thing I learned recently is that it may be very useful to switch back and forth between the Dependency Matrix and the Dependency Graph and in the image below I show both windows next to each other. In this simple case they show the same thing but when the code base grows then dependencies become too numerous to be shown visually in a useful way. Luckily there are options in the matrix to show parts of it the graph, and vice versa. For example, right clicking on namespace row heading opens a menu with a View Internal Dependencies On Graph option so that only a subset of the code base dependencies are shown. Very useful indeed.

Here’s what it may look like:

A simple sample project with just three namespaces

A simple sample project with just three namespaces

Also note that hovering over a dependency cell displays useful popups and changes the cursor into an arrow indicating the direction of the dependency, which is also reflected by the color of the cell (by the way, look out for black cells, they indicate circular references!)

Another way to invoke the graph is to right click a dependency cell in the matrix:

Context menu for a dependency


The top option, Build a Graph made of Code Elements involved in this dependency does just what is says. Also very useful.

By using the expand/collapse functionality of the dependency matrix together with the option to display dependencies in the graph view it becomes easier to pinpoint structual problems in the code base. It takes a bit of practise because of the sheer amount of information in the matrix but I’m growing into liking it more and more. I would suggest anyone interested to spend some time on this view and it’s many options. I found this official description to be useful for a newcomer: Dependency Structure Matrix

Wrapping it up

NDepend 6 has many more features than what I have described here and it’s such a useful tool that I would suggest anyone interested in code quality to download a trial and play around with it. Just be prepared to invest some time into learning the tool to get the most out of it.

A very good way to get started is the Pluralsight course by Eric Dietrich. It describes NDepend version 5 but all of it applies to version 6 as well and it covers the basics of the tool very well. Well worth a look if you’re a Pluralsight subscriber.

Devart LINQ Insight

I was recently approached by a representative from Devart who asked if I wanted to have a look at some of their products, so I decided to try out the LINQ Insight add-in for Visual Studio.

LINQ Insight has two main functions:

  • Profiler for LINQ expressions
  • Design-time LINQ query analyzer and editor

If you work much with LINQ queries you probably know that Visual Studio is somewhat lacking with functionality around LINQ queries by default so the functions that LINQ Insight offers should be pretty welcome for any database developer out there on the .Net platform (which should be pretty many of us these days). Let’s discuss the two main features of LINQ Insight in some more detail.

Profiling LINQ queries

If you’re using Entity Framework (LINQ Insight apparently also supports NHibernate, RavenDB, and a few others but I have not tested any of those) and LINQ it can be a little difficult to know exactly what database activity occurs during the execution of the applications. After all, the main objective of OR mappers is to abstract away the details of the database and instead let the developer focus on the domain model. But when you’re debugging errors or analyzing performance it’s crucial to analyze the database activity as well, and that’s what LINQ Insight’s profiling function helps with.

There are other tools to this of course, such as IntelliTrace in Visual Studio Ultimate, but since it’s only included in Ultimate, not many developers have access to it. LINQ Insight profiler is very easy to use and gives access to a lot of information.

To enable profiling, follow these steps:

  1. Make sure that IIS Express process is not started. Stop it if it is. (This assumes we’re using IIS Express of course. I’m not quite sure how to work with the full IIS server in conjunction with LINQ Insight.)
  2. Open the profiling window by selecting View/Other Windows/LINQ Profiler, or pressing Ctrl+W, F
  3. Press the “Start profiler session” button in the upper left corner of the window (it looks like a small “Play” icon)
  4. Start debugging your application, for example by pressing F5.
  5. Debugging information such as this should now start to fill the profiler window:

    The profiler displays all LINQ activity in the application.

    The profiler displays all LINQ activity in the application.

    As you can see, in this case we have several different contexts that have executed LINQ queries. For example, ApplicationContext is used by ASP.Net Identity and HistoryContext is used by Code First Database Migrations. Context is our application context.

  6. We can now drill down into the queries and see what triggered them and what SQL statements were executed.

    Drilling down into profiler data.

    Drilling down into profiler data.

    We can see the LINQ query that was executed, the SQL statements, duration, call stack, etc. Very useful stuff indeed.

Query debugger and editor

The other feature LINQ Insight brings into Visual Studio is to help writing LINQ queries and debug them. To debug a query, follow these steps:

  1. To open a query in the query editor, just right-click on it in the standard C# code editor window and select the “Run LINQ Query” option:

    To debug or edit a LINQ query, use the right-click menu.

    To debug or edit a LINQ query, use the right-click menu.

  2. If the query contains one or more parameters, a popup will be shown where values for the parameters can be given.
  3. Next, the query will be executed, and the results will be displayed:

    Query results are displayed in the Results tab.

    Query results are displayed in the Results tab.

  4. This is of course useful in itself, and even better is that the generated Sql statements are displayed in the SQL tab and the original LINQ query is in the LINQ tab, where it can be edited and re-executed, after which the Sql and Results tab are updated. Really, really useful!

If an error is displayed in the Results tab, then the most probably reason is that the database could not be found in the project’s config file, or that it could not be interpreted correctly. The latter is the case if using the LocalDB provider with the "|DataDirecory|" placeholder, which only can be evaluated at runtime in a ASP.Net project. To make LINQ Insight find a database MDF file in App_Data in a web project, you can follow these steps:

  1. Make sure that your DbContext sub-class (for Entity Framework, that is) has an overloaded constructor that takes a single string parameter, namely the connection string to use:
    public Context(string connString) : base(connString) {}
    

    This is required if LINQ Insight cannot deduce the connection string for the project’s config file. This is usually a problem in my projects since I like to separate domain logic into a separate project (normally a class library) from my “host application”.

  2. Double-click the MDF file in the App_Data folder to make sure it’s present in the Server Explorer panel in Visual Studio.
  3. Select the database in the Server Explorer and right-click it and select Properties. Copy its Connection String property.
  4. In the LINQ Interactive window, click the Edit Connection String button, which is only enabled if the DbContext class has a constructor overload with a connection string parameter, which we ensured in step 1.
  5. Paste the connection string to the Data/ConnectionString field in the panel:

    Use the connection string dialog to override the "guessed" connection string.

    Use the connection string dialog to override the “guessed” connection string.

    Click OK to close the dialog.

  6. Re-run the query with the Run LINQ Query button in the LINQ Interactive window, and it should now work correctly. If it doesn’t, try to Run LINQ Query command in the C# code editor again, since it re-initializes the query.

The ability to freely set the connection string should make it possible to work against any database, be it a local MDF file, a full SQL Server database or a Windows Azure database. This could be used as a simple way to try out new or modified LINQ queries against a staging or production database, right from the development enviroment. Could be very useful in some situations for debugging nasty errors and such.

Summary

All in all, I think the LINQ Insight is a very useful tool and I recommend you try it out if you find yourself writing LINQ queries from time to time.

I should also mention that if you have tried LINQ Insight before and found it be slightly unstable then I should mention that Devart have recently fixed a few errors that really makes the tool much more robust and useful. If unsure, just download the trial version and test it out.

Happy Linqing!

Emil

Grouping by feature in ASP.Net MVC

Motivation

When I initially switched from using ASP.Net Web Forms to MVC as my standard technology for building web sites on the Microsoft stack I really liked the clean separation of the models, views and controllers. No more messy code-behind files with scattered business logic all over the place!

After a while though, I started to get kind of frustrated when editing the different parts of the code. I often find that a change in one type of file (e.g. the model) tend to result in corresponding changes in other related files (the view or the controller) and for any reasonably large project you’ll start to spend considerable time in the Solution Explorer trying to find the files that are affected by your modifications. It turns out that the default project structure of ASP.Net MVC actually does a pretty poor job of limiting change propagation between the files used by a certain feature. It’s still much better than Web Forms, but it’s by no means perfect.

The problem is that the default project structure separates the files by file type first and then by controller. This image shows the default project structure for ASP.Net MVC:

Default ASP.Net MVC project structure

Default ASP.Net MVC project structure

The interesting folders are Controllers, Models (which really should be called ViewModels) and Views. A given feature, for example the Index action on the Account controller, is implemented using files in all these folders and potentially also one or more files in the Scripts folder, if Javascript is used (which is very likely these days). Even if you need to make only a simple change, such as adding a property to the model and show it in a view, you’ll probably need to edit files in several of these directories which is fiddly since they are completely separated in the folder structure.

Wouldn’t it be much better to group files by feature instead? Yes, of course it would, when you think about it. Fortunately it’s quite easy to reconfigure ASP.Net MVC a bit to accomplish this. This is the goal:

Grouping by feature

Grouping by feature


Instead of the Controllers, Models and Views folders, we now have a Features folder. Each controller now has a separate sub-folder and each action method has a sub-folder of their own:

  • Features/
    • Controller1/
      • Action 1/
      • Action 2/
    • Controller2/
      • Action 1/
      • Action 2/

Each action folder contains the files needed for its implementation, such as the view, view model and specific Javascript files. The controller is stored on level up, in the controller folder.

What we accomplish by doing this is the following:

  1. All the files that are likely to be affected by a modification are stored together and are therefore much easier to find.
  2. It’s also easier to get an overview of the implementation of a feature and this in turn makes it easier to understand and work with the code base.
  3. It’s much easier to delete a feature and all related files. All that has to be done is to delete the action folder for the feature, and the corresponding controller action.

Implementation

After that rather long motivation, I’ll now show how to implement the group by feature structure. Luckily, it’s not very hard once you know the trick. This is what has to be done:

  1. Create a new folder called Features, and sub-folders for the controllers.
  2. Move the controller classes into their respective sub-folders. They don’t need to be changed in any way for this to work (although it might be nice to adjust their namespaces to reflect their new locations). It turns out that MVC does not assume that the controllers are located in any specific folder, they can be placed anywhere we like.
  3. Create sub-folders for each controller action and move their view files there. Rename the view files to View.html as there’s no need to reflect the action name in the file name anymore.

If you try to run your application at this point, you’ll get an error saying that the view cannot be found:

The view 'Index' or its master was not found or no view engine supports the searched locations. The following locations were searched:
~/Views/Home/Index.aspx
~/Views/Home/Index.ascx
~/Views/Shared/Index.aspx
~/Views/Shared/Index.ascx
~/Views/Home/Index.cshtml
~/Views/Home/Index.vbhtml
~/Views/Shared/Index.cshtml
~/Views/Shared/Index.vbhtml

This is exactly what we’d expect, as we just moved the files.

What we need to do is to tell MVC to look for the view files in their new locations and this can be accomplished by creating a custom view engine. That sounds much harder than it is, since we can simply inherit the standard Razor view engine and override its folder setup:

using System.Web.Mvc;

namespace RetailHouse.ePos.Web.Utils
{
    /// <summary>
    /// Modified from the suggestion at
    /// http://timgthomas.com/2013/10/feature-folders-in-asp-net-mvc/
    /// </summary>
    public class FeatureViewLocationRazorViewEngine : RazorViewEngine
    {
        public FeatureViewLocationRazorViewEngine()
        {
            var featureFolderViewLocationFormats = new[]
            {
                // First: Look in the feature folder
                "~/Features/{1}/{0}/View.cshtml",
                "~/Features/{1}/Shared/{0}.cshtml",
                "~/Features/Shared/{0}.cshtml",
                // If needed: standard  locations
                "~/Views/{1}/{0}.cshtml",
                "~/Views/Shared/{0}.cshtml"
            };

            ViewLocationFormats = featureFolderViewLocationFormats;
            MasterLocationFormats = featureFolderViewLocationFormats;
            PartialViewLocationFormats = featureFolderViewLocationFormats;
        }
    }
}

The above creates a view engine that searches the following folders in order (assuming the Url is /Foo/Index):

  1. ~/Features/Foo/Index/View.cshtml
  2. ~/Features/Foo/Shared/Index.cshtml
  3. ~/Features/Shared/Index/View.cshtml
  4. ~/Views/Foo/Index.cshtml
  5. ~/Views/Shared/Index.cshtml

The last two are just used for backward compatibility so that it isn’t necessary to refactor all controllers at once.

To use the new view engine, do the following on application startup:

ViewEngines.Engines.Clear();
ViewEngines.Engines.Add(new FeatureViewLocationRazorViewEngine());

The view will now load and the application will work as before, but with better structure.

The last step is to move view models and custom Javascript files into the action folders as well (note that the latter requires adjusting the paths in the HTML code that includes the Javascript files to reflect the new locations).

Once everything is up and running, the project becomes much easier to work with and when you get used to working like this you really start to wonder why Microsoft is not doing it by default in their Visual Studio templates. Maybe in a future version?

/Emil

Updates
2014-11-21 Updated the images to clarify the concept

Connection strings used for logging should not enlist in transactions

I was just reminded of an old truth when it comes to logging errors in a database: Do not enlist the error logging operation in the current transaction, if there is one! The default is to do just that, so be sure to add Enlist=false in your connection string used for logging:

Example:

  <connectionStrings>
    <add name="myDb" connectionString="..."  providerName="System.Data.SqlClient"/>
    <add name="logging" connectionString="...;Enlist=false"  providerName="System.Data.SqlClient"/>
  </connectionStrings>

If you don’t, then the error logging will be rolled back with the transaction in case of an error. Not so good…

Also note that it’s a good idea to use separate connection strings for the normal database operations (which should be done inside transactions) and the logging operations (that shouldn’t).

Now that I have written this down I will hopefully remember this the next time I do error logging in a database…

/Emil

Fixing CLR trigger error after installing .Net Framework updates

Today I discovered an error in one of our CLR triggers in a SQL Server database:

System.Data.SqlClient.SqlException: A .NET Framework error occurred during execution of user-defined routine or aggregate "PersonalChangedTrigger": 
System.IO.FileLoadException: Could not load file or assembly 'System.Messaging, Version=2.0.0.0, Culture=neutral, PublicKeyToken=b03f5f7f11d50a3a' or one of its dependencies. Assembly in host store has a different signature than assembly in GAC. (Exception from HRESULT: 0x80131050) See Microsoft Knowledge Base article 949080 for more information.

This was kind of unexpected since we didn’t modify the trigger. It turns out that it was probably a Windows Update patch that modified the System.Messaging assembly so we had to “re-import” it into the database. This is how to do that, in our case:

ALTER ASSEMBLY Messaging
FROM 'C:\WINDOWS\Microsoft.NET\Framework\v2.0.50727\System.Messaging.dll'
WITH PERMISSION_SET = UNSAFE

/Emil