
Background
We recently had a nasty memory leak after deploying a new version of a project I’m involved in. The new version contained 4 months of changes compared to the previous version and because so many things had changed it was not obvious what caused the problem. We tried to go through all the changes using code compare tools (Code Compare is a good one) but could not find anything suspicious. It took us about a week to finally track down the problem and in this post I’ll write down a few tips that we found helpful. The next time I’m having a difficult memory problem I know where to look, and even if this post is a bit unstructured I hope it contains something useful for other people as well.
.Net memory vs native memory
The first few days we were convinced that we had made a logical error or had made some mistakes in I/O access. We also suspected that our caching solutions had gone bad, but it was hard to be sure. We used Dynatrace to get .Net memory dumps from other environments than our production environment which has zero downtime requirements. We also used a memory profiler (dotMemory) to see if we could see any trends in memory usage one local dev machines with a crawler running, but nothing conclusive could be found.
Then we got a tip to have a look at a few Windows performance counters that can help track down this kind of problem:
- Process / Private Bytes – the total memory a process has allocated (.Net and native combined)
- .NET CLR Memory / # Bytes in all Heaps – the memory allocated for .Net objects
We added these two for our IIS application pool process (w3p.exe) and it turned out that the total memory allocations increased but that the .Net memory heap did not:
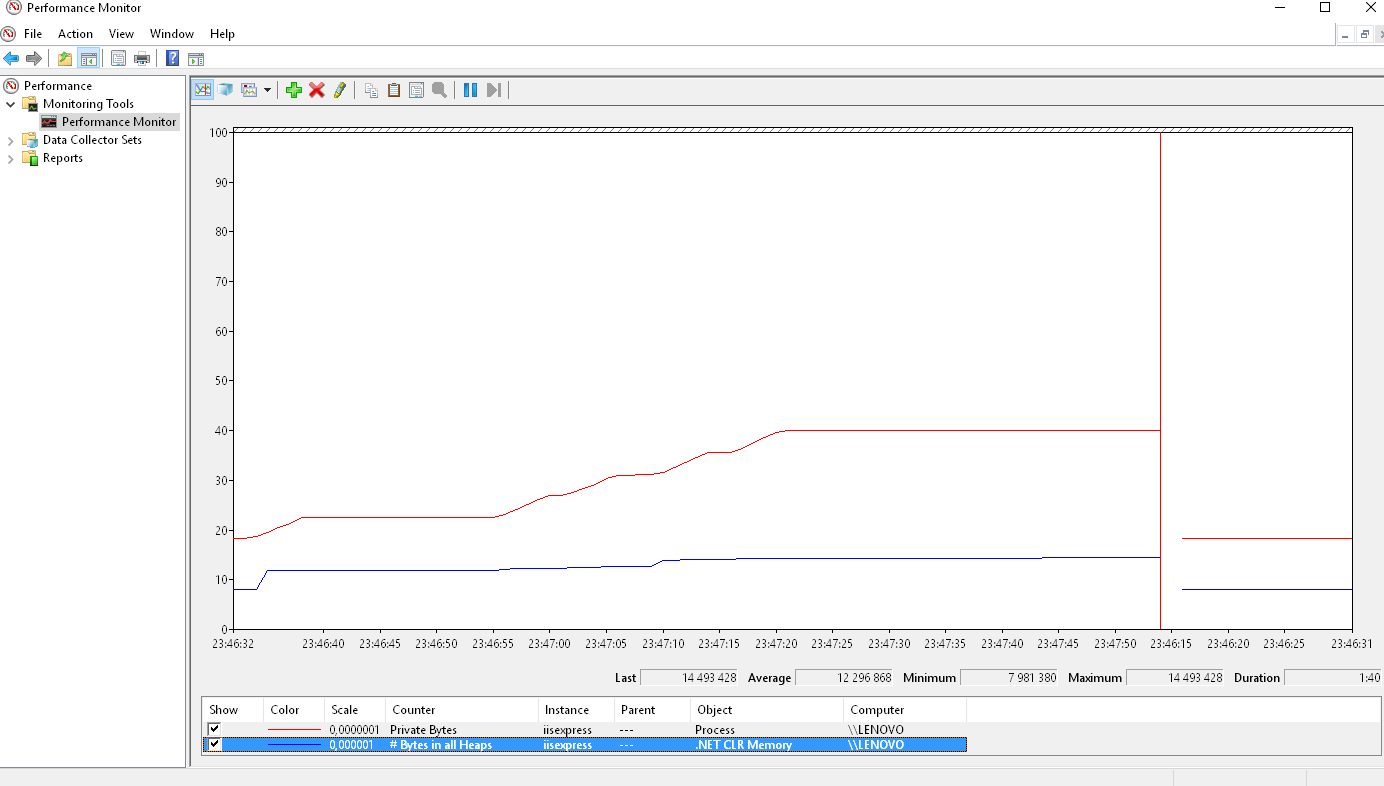
Total memory usage (red line) is increasing but the .Net memory heap allocations (blue) are not.
This means that it’s native memory that gets leaked and we could rule out our caching and other .Net object allocations.
What is allocated?
So we now knew it was native memory that was consumed, but not what kind of memory.
One classic type of memory leak is to not release files and other I/O objects properly and we got another tip for how to check for that, namely to add the Process / Handle Count performance counter. Handles are small objects used to reference different types of Windows objects, such as files, registry items, window items, threads, etc, etc, so it’s useful to see if that number increases. And it did:
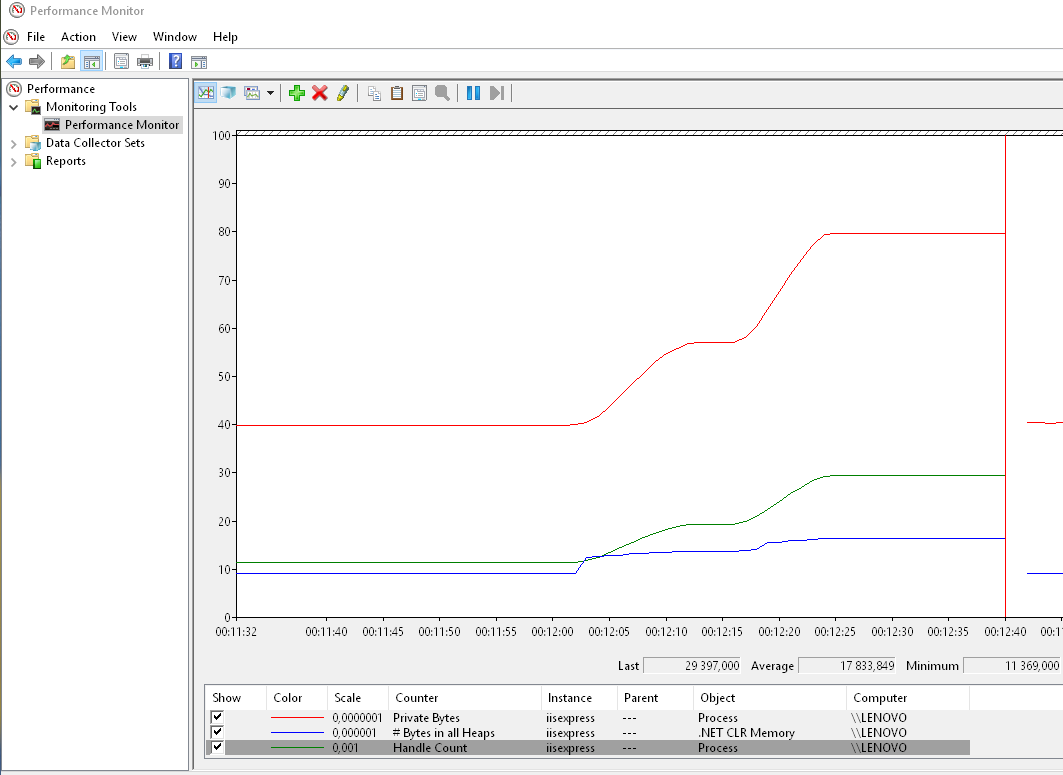
The handle count (green) followed the increased memory usage very closely.
By clicking on a counter in the legend we could see that the number of active handles increased to completely absurd levels, a few hours after an app pool recycle we had 2-300 000 active handles which definitely indicates a serious problem.
What type of handles are created?
The next step was to try to decide what type of handles were created. We suspected some network problem but were not sure. We then find out about this little gem of a tool: Sysinternals Handle. It’s a command line tool that can list all active handles in a process and to function properly it must be executed with administrative privileges (i.e. start the Powershell console with “Run as Administrator”). It also has a handy option to summarize the number of handles of each type which we used like this:
PS C:\utils\Handle> .\Handle.exe -p 13724 -s

Handle v4.0
Copyright (C) 1997-2014 Mark Russinovich
Sysinternals - www.sysinternals.com

Handle type summary:
  ALPC Port       : 8
  Desktop         : 1
  Directory       : 5
  EtwRegistration : 158
  Event           : 14440
  File            : 226
  IoCompletion    : 8
  IRTimer         : 6
  Job             : 1
  Key             : 96
  Mutant          : 59
  Section         : 258
  Semaphore       : 14029
  Thread          : 80
  Timer           : 1
  Token           : 5
  TpWorkerFactory : 3
  WaitCompletionPacket: 15
  WindowStation   : 2
Total handles: 29401
It was obvious that we had a problem with handles of the Event and Semaphore types. To focus on just those two when experimenting we used simple PowerShell string filtering to make these two stand out better:
PS C:\utils\Handle> .\Handle.exe -p 13724 -s | select-string "event|semaphore"

  Event           : 14422
  Semaphore       : 14029
At this point we had a look again at the code changes made during the 4 months but could still not see what could be causing the problems. There was a new XML file that was accesses but that code used an existing code pattern we had and since we were looking at Event and Semaphore handles it did not seem related.
Non-suspending memory dumps
After a while someone suggested using Sysinternals Procdump to get a memory dump from the production environment without suspending the process being dumped (which happens when using the Create dump file option in Task Manager) using a command line like this:
PS C:\Utils\Procdump> .\procdump64.exe -ma 13724 -r

ProcDump v8.0 - Writes process dump files
Copyright (C) 2009-2016 Mark Russinovich
Sysinternals - www.sysinternals.com
With contributions from Andrew Richards

[00:31:19] Dump 1 initiated: C:\Utils\Procdump\iisexpress.exe_160619_003119.dmp
[00:31:20] Waiting for dump to complete...
[00:31:20] Dump 1 writing: Estimated dump file size is 964 MB.
[00:31:24] Dump 1 complete: 967 MB written in 4.4 seconds
[00:31:24] Dump count reached.
The -r option results in that a clone of the process being dumped is created so that the dump can be taken without bringing the site to a halt. We monitored the number of requests per second during the dump file creation using the ASP.NET Applications / Requests/Sec performance counter and it was not affected at all.
Now that we had a dump file, we analyzed it in the Debug Diagnostic Tool v2 from Microsoft. We used the MemoryAnalysis option and loaded the previously created dump under Data Files:
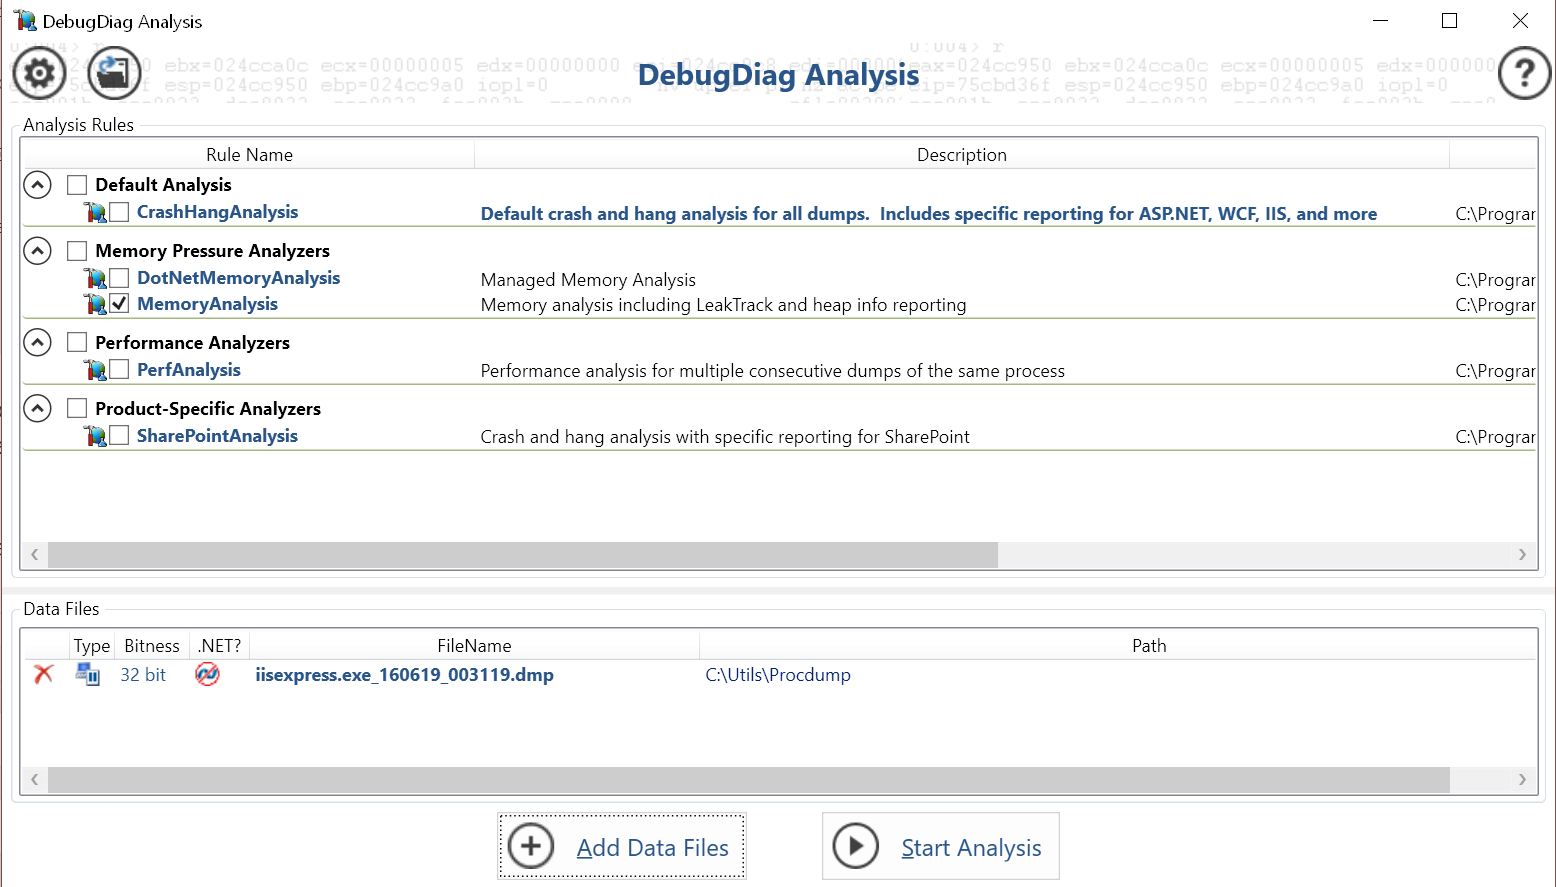
Using the memory analysis function on a dump file.
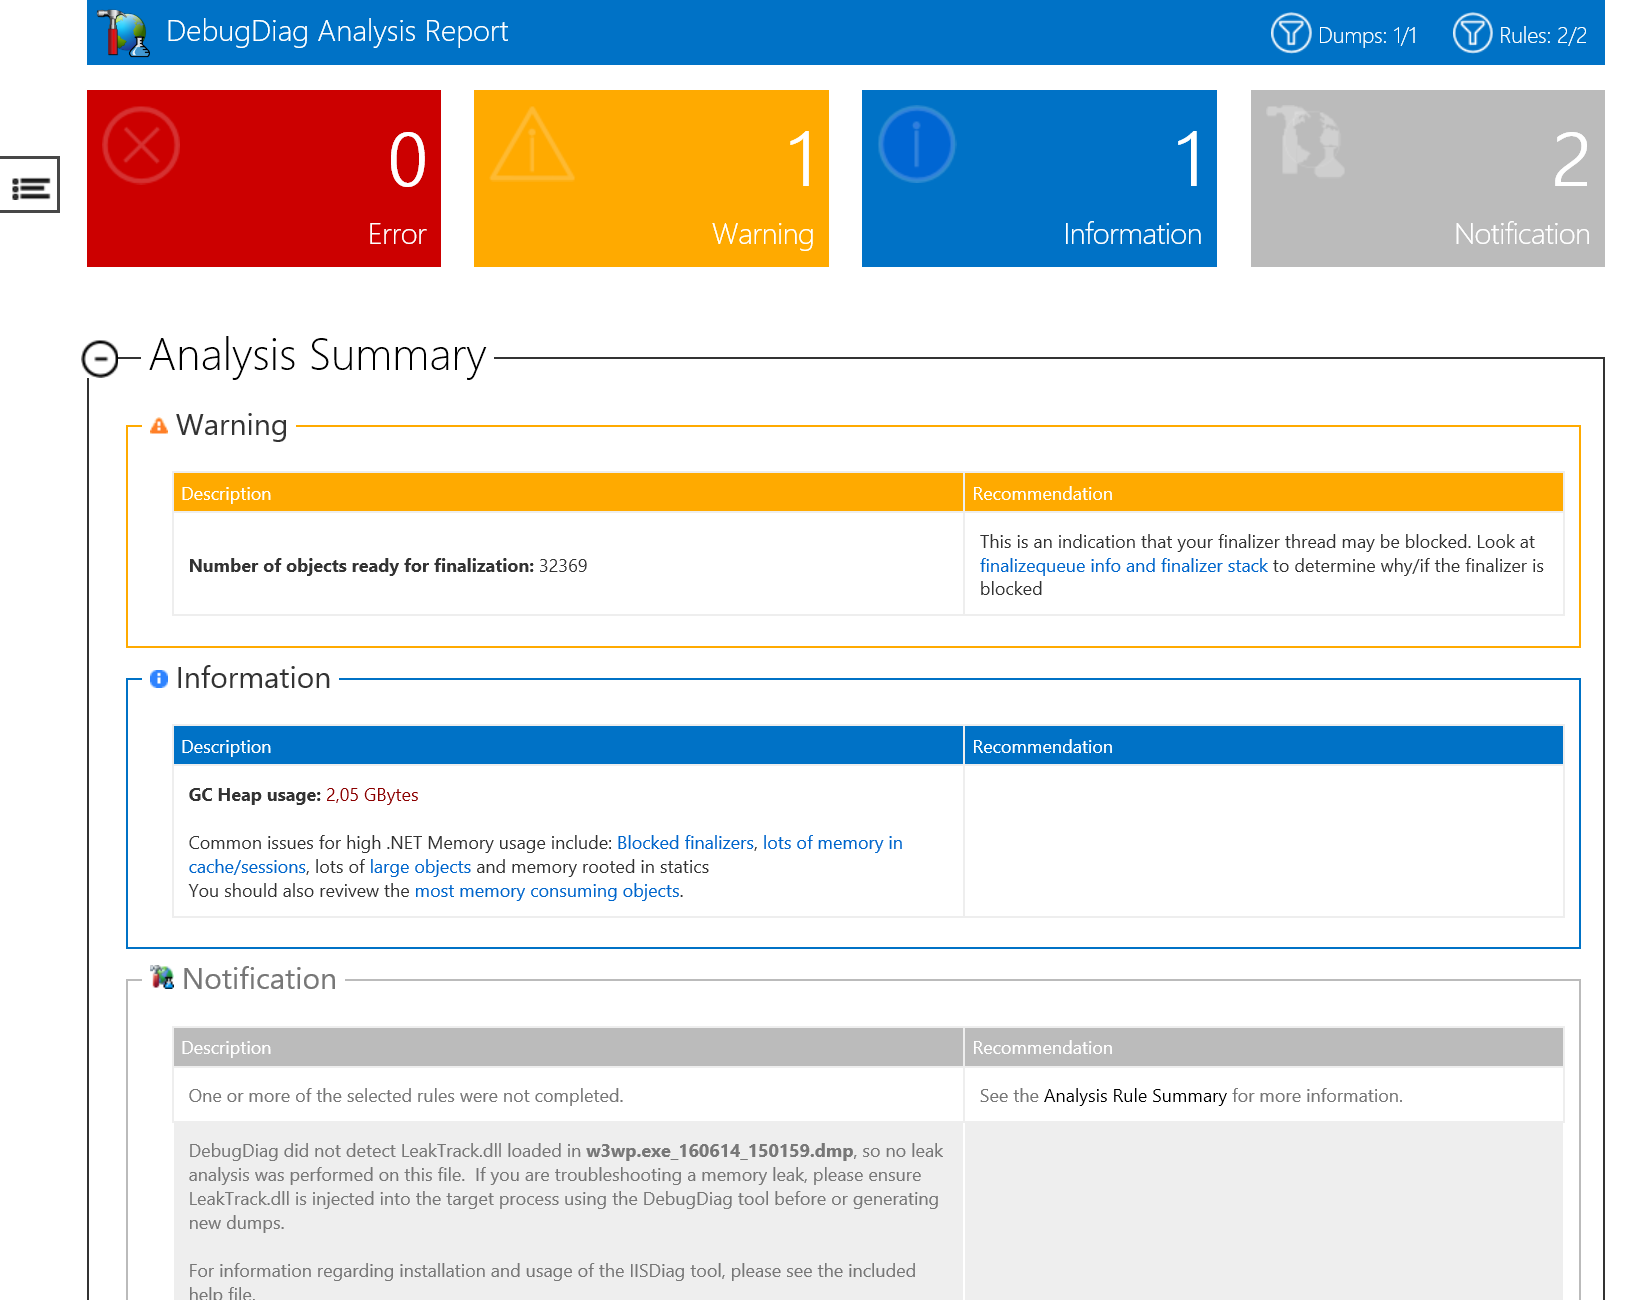
The report showed a warning about the finalize queue being very long but that did not explain very much to us, except that something was wrong with deallocating some types of objects.
Debug Diagnostic Tool report
There was just one warning after the memory analysis of the dump, that there were a lot of object that were not finalized.
The report also contained a section about the type of object in the finalize queue:
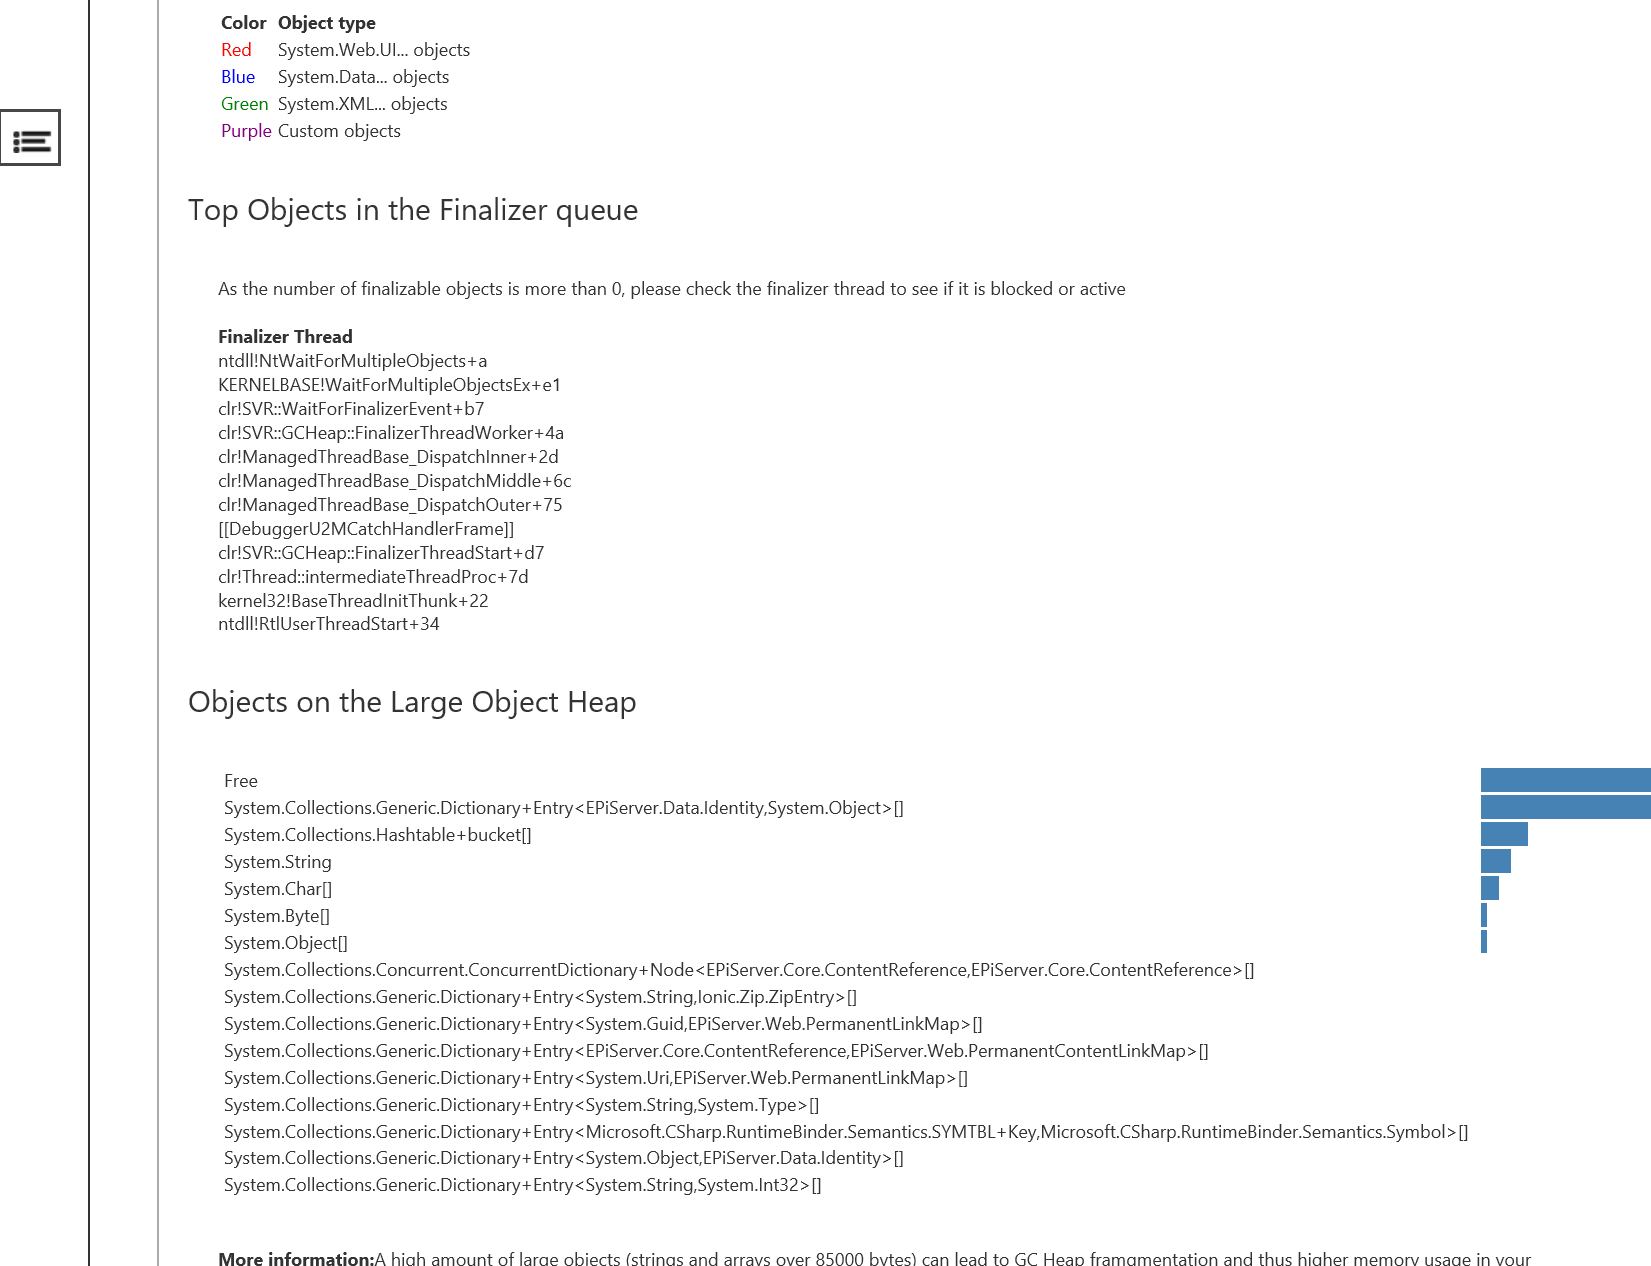
The finalizer queue in the Debug Diagnostic Tool report
The most frequent type of object in the queue is undeniably related to our Event and Semaphore handles.
The solution
The next day, one of the developers thought again about what we had changed in the code with regards to handles and again landed on the code that opened an XML file. The code looked like this:
private static IEnumerable<Country> GetLanguageList(string fileFullPath)
{
    List<Country> languages;
    var serializer = new XmlSerializer(typeof(List<Country>),
        new XmlRootAttribute("CodeList"));
    using (var reader = XmlReader.Create(fileFullPath))
    {
        languages = (List<Country>)serializer.Deserialize(reader);
        foreach (var c in languages)
            c.CountryName = c.CountryName.TrimStart().TrimEnd();
    }
    return languages;
}
It looks pretty innocent but he decided to Google “XmlSerializer memory leak”, and what do you know, the first match is a blog post by Tess Fernandez called .NET Memory Leak: XmlSerializing your way to a Memory Leak… It turns out that there is an age-old bug (there is no other way of classifying this behavior) in XmlSerializer that it will not return all memory when deallocated, for some of its constructors. This is even documented by Microsoft themselves in the docs for the XmlSerializer class, under the Dynamically Generated Assemblies heading it says:
If you use any of the other constructors, multiple versions of the same assembly are generated and never unloaded, which results in a memory leak and poor performance.
Yes, indeed it does… Since .Net Framework 1.1, it seems. It turns out we should not create new instances of the XmlSerializer class, but cache and reuse them instead. So we implemented a small cache class that handles the allocation and caching of these instances:
using System.Collections.Concurrent;
using System.Xml.Serialization;

namespace Xena.Web.Services
{
    public interface IXmlSerializerFactory
    {
        XmlSerializer GetXmlSerializer<T>(string rootAttribute);
    }

    public class XmlSerializerFactory : IXmlSerializerFactory
    {
        private readonly ConcurrentDictionary<string, XmlSerializer> _xmlSerializerCache;

        public XmlSerializerFactory()
        {
            _xmlSerializerCache = new ConcurrentDictionary<string, XmlSerializer>();
        }

        public XmlSerializer GetXmlSerializer<T>(string rootAttribute)
        {
            var key = typeof(T).FullName + "#" + rootAttribute;

            var serializer = _xmlSerializerCache.GetOrAdd(key,
                k => new XmlSerializer(typeof (T), new XmlRootAttribute(rootAttribute)));

            return serializer;
        }
    }
}
This class has to be a singleton, of course, which was configured in our DI container StructureMap like this:
container.Configure(c => c.For(typeof(IXmlSerializerFactory)).Singleton().Use(typeof(XmlSerializerFactory)));
And finally, everything worked like a charm, with horizontal memory graphs. 🙂
Using handle.exe it was easy to verify on the developer machines that the XmlSerializerFactory actually solved the problem since the Semaphore handle count now remained constant after page views. If we only had had the memory graphs to go by, it would have taken much longer to verify the non-growing memory trend since the total memory allocations always fluctuates during execution.
/Emil
Hi,
I have tried using Debug Diagnostics tool with the dmp file but it will not work since for unmanaged handle leak analysis it has to collect the dump itself, otherwise analysis will not run. Would you please recall how you managed to make it work then? Thanks.
Well, as mentioned in the post we used Procdump from a console window with administrative privileges. Apart from that I don’t recall any problems with taking the dump.
You might want to check the version of the Debug Diagnostic Tool. I remember that I accidentally downloaded version 1 at first, which did not work and gave me some peculiar error messages (I don’t remember exactly what they were). Once I found the latest version it worked correctly.
Thanks for the post! I downloade the Debug Diag tool but can’t find an option to load a saved dump-file.
Do I have to create some “rule” or something?
Hi Alex. I have to confess I don’t quite remember the details but I believe you can use the “Add Data Files” button to do this, as described in Step 6 here: https://support.microsoft.com/en-ca/help/919791/how-to-use-the-debug-diagnostics-tool-to-troubleshoot-high-cpu-usage-b
HTH
/Emil
There is a newer version of Debug Diagnostic Tool v2 Update 3 available at https://www.microsoft.com/en-us/download/confirmation.aspx?id=58210
After installation in the Debug Diagnostics Tool help (C:\Program Files|DebugDiag\DebugDiag.chm) I found the “Troubleshooting Memory Leaks with DebugDiag” article, which suggests to run the Debug Diagnostic Tool instead of the Sysinternals Procdump to get dumps. When the dump is collected with the Memory Leaks information, the analysis report will contain the “Leak Analysis” section as described in the “Understanding the Analysis Reports” help article.
After getting a dump using Sysinternals Procdump and analysing it in the Debug Diagnostic tool, the Analysis Report contains the following message: “DebugDiag did not detect LeakTrack.dll loaded in w3wp.exe_201001_084809.dmp, so no leak analysis was performed on this file. If you are troubleshooting a memory leak, please ensure LeakTrack.dll is injected into the target process using the DebugDiag tool before or generating new dumps.”