Creating ASP.Net Web API:s and generate clients with NSwag – Part 2

This is the second part of a two-post series about creating a Web API REST service written in ASP.Net Core and consuming it using the NSwag toolchain to automatically generate the C# client code.

The first part described how to set up the service and now it’s time to consume it by generating an API client using NSwag.

Note: We can use this method to consume any REST API that exposes a service description (i.e. a “swagger file”), we’re not at all limited to .Net Web API services.

Example code is available on GitHub.

Generating clients

Once the service has a correct Swagger service description (the JSON file) we can start consuming the service by generating clients. There are several different tools for doing this and in this blog post I’ll use NSwag which is currently my favorite client generation tool as it’s very configurable and was built from the start for creating API clients for .Net.

NSwag has many options and can be used in two main ways:

  1. As a visual tool for Windows, called NSwagStudio
  2. As a command line tool, NSwag.exe, which is what I’ll describe here

NSwag.exe has many options so to make it easy to use it makes sense to create scripts that call the tool. The tool can also use saved definitions from NSwagStudio if that better suits your workflow, but I find it easier to just pass in all the options to NSwag.exe since it’s more transparent what settings are used.

Here’s how I currently use NSwag.exe to generate C# clients using a Powershell script:

function GenerateClient(
    $swaggerUrl,
    $apiNamespace,
    $apiName,
    $apiHelpersNamespace) {
    $apiHelpersNamespace = "${apiNamespace}.ApiHelpers"
    $clientFileName = "${apiName}Client.cs"
    $clientExtendedFileName = "${apiName}Client.Extended.cs"

    nswag openapi2csclient `
        "/Input:${swaggerUrl}" `
        "/Output:${clientFileName}" `
        "/Namespace:${apiNamespace}.${apiName}Api" `
        "/ClassName:${apiName}Client" `
        "/ClientBaseClass:${apiHelpersNamespace}.ApiClientBase" `
        "/GenerateClientInterfaces:true" `
        "/ConfigurationClass:${apiHelpersNamespace}.ApiConfiguration" `
        "/UseHttpClientCreationMethod:true" `
        "/InjectHttpClient:false" `
        "/UseHttpRequestMessageCreationMethod:false" `
        "/DateType:System.DateTime" `
        "/DateTimeType:System.DateTime" `
        "/GenerateExceptionClasses:false" `
        "/ExceptionClass:${apiHelpersNamespace}.ApiClientException"

    if ($LastExitCode) {
        write-host ""
        write-error "Client generation failed!"
    }
    else {
        write-host -foregroundcolor green "Updated API client: ${clientFileName}"

        if (-not (test-path $clientExtendedFileName)) {
            write-host ""
            write-host "Please create partial class '${clientExtendedFileName}' with overridden method to supply the service's base address:"
            write-host ""
            write-host -foregroundcolor yellow "`tprotected override Uri GetBaseAddress()"
            write-host ""
        }
    }
}

$apiName = 'Weather'
$swaggerUrl = 'http://localhost:5000/swagger/v1/swagger.json'
$apiNamespace = 'WebApiClientTestApp.Client'

GenerateClient $swaggerUrl $apiNamespace $apiName


I use the openapi2csclient generator (called swagger2csclient in previous NSwag versions) to create a C# class for calling the REST API, based on the swagger.json file for the service.  Except for some obvious options for input and out paths, and class name and namespace, some of these options need a few words of explanation.

  • /GenerateClientInterfaces is used to generate a C# interface so that the client class can easily be mocked when writing unit tests on classes that call the client.
  • /ClientBaseClass is the name of a base class that the generated client class will inherit from. This is useful for collecting common code that should be performed for more than one API client, such as authentication, configuration or error handling. Depending on other options, this base class is expected to contain some predefined methods (see here for more details). This is an example of what the base class might look like:
public abstract class ApiClientBase
{
    protected readonly ApiConfiguration Configuration;

    protected ApiClientBase(ApiConfiguration configuration)
    {
        Configuration = configuration;
    }

    // Overridden by api client partial classes to set the base api url. 
    protected abstract Uri GetBaseAddress();

    // Used if "/UseHttpClientCreationMethod:true /InjectHttpClient:false" when running nswag to generate api clients.
    protected async Task<HttpClient> CreateHttpClientAsync(CancellationToken cancellationToken)
    {
        var httpClient = new HttpClient {BaseAddress = GetBaseAddress()};
        return await Task.FromResult(httpClient);
    }
}

  • /ConfigurationClass is the name of a class used to pass configuration data into Api client.
  • /InjectHttpClient:false and /UseHttpClientCreationMethod:true are used to give the base class control of how the Http Client instance is created which can be useful for setting default headers, authentication etc.
  • /DateType:System.DateTime and /DateTimeType:System.DateTime are used to create standard .Net DateTime types for dates rather than DateTimeOffset which NSwag for some reason seems to default to.
  • /GenerateExceptionClasses:false and /ExceptionClass are used to stop exception types from being generated for the APi client. The generated client will treat all 4xx and 5xx HTTP status codes on responses as errors and will throw an exception when it sees them. By using these options we can control the exception type so that all our generated API clients use the same exception type will greatly will simplify error handling.

The generated C# client is marked as partial which allows us to manually create a small file for supplying information to the base class:

public partial class WeatherClient
{
  protected override Uri GetBaseAddress()
  {
    return new Uri(Configuration.WeatherApiBaseUrl);
  }
}

And that’s all we need to generate the clients with full control over the error handling, HTTP client creation. To generate the client, start the service and run the above script and the client C# class is automatically generated.

Test project

To test this out, get the example code from GitHub. The solution contains to projects:

  • WebApiClientTestApp.Api – a service with an example endpoint
  • WebApiClientTestApp.Client – a console app with a client that call the service

Starting first the Api project and then the Client project will print out the following in a command prompt:

Generating the client

To regenerate the client, first install NSwagStudio. Either the MSI installer or the Chocolatey installation method should be fine. Then start the Api project and open a Powershell prompt while the Api is running. Go to the Client project’s WeatherApi folder and type:

.\GenerateClient.ps1

The result should be something like this:

(If your output indicates an error you may have to run the Powershell as Administrator.)

The WeatherClient.cs file is now regenerated but unless the Api code is changed, the new version will be identical to the checked-in file. Try to delete it and regenerate it to see if it works.

The Powershell script can now be used every time the API is changed and the client needs to be updated.

Summary

By installing NSwagStudio and running the included console command nswag.exe, we are now able to generate an API client whenever we need to.

Note that the client generation described in this post is not limited to consuming .Net REST API:s, it can be used for any REST API that exposes service description files (swagger.json) properly, which makes this a very compelling pattern.

/Emil

Creating ASP.Net Web API:s and generate clients with NSwag – Part 1

This is the first part of a two-post series about creating a Web API REST service written in ASP.Net Core and consuming it using the NSwag toolchain to automatically generate the C# client code. This way of consuming a web service puts some requirements on the OpenAPI definition (previously known as Swagger definition) of the service so in this first part I’ll describe hot to properly set up a service so it can be consumed properly using NSwag.

The second part shows how to generate client code for the service.

Example code is available on GitHub.

Swashbuckle

When a new Web Api project (this post describes Asp.Net Core 3.0) is created in Visual Studio, it contains a working sample service but the code is missing a few crucial ingredients.

The most notable omission is that the service is missing an OpenAPI service description (also known as a Swagger description). On the .Net platform, such a service description is usually created automatically based on the API controllers and contracts using the Swashbuckle library.

This is how to install it and enable it in Asp.Net Core:

  1. Add a reference to the Swashbuckle.AspNetCore Nuget package (the example code uses version 5.0.0-rc5).
  2. Add the following to ConfigureServices(IServiceCollection services) in Startup.cs:
    services.AddSwaggerGen(c =>
      {
        c.SwaggerDoc("v1", new OpenApiInfo { Title = "My API", Version = "v1" });
      });
    
  3. Also add these lines to Configure(IApplicationBuilder app, IWebHostEnvironment env) in the same file:
    app.UseSwagger();
    app.UseSwaggerUI(c =>
      {
        c.SwaggerEndpoint($"/swagger/v1/swagger.json", ApiName);
      });
    

The first call enable the creation of the service description file and the second enables the UI for showing the endpoints with documentation and basic test functionality.

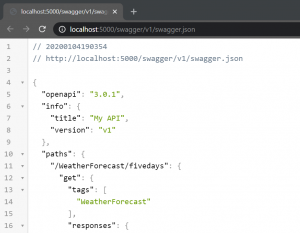
After starting the service, the description is available at this adress: /swagger/v1/swagger.json


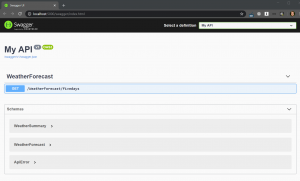
More useful than this is the automatically created Swagger UI with documentation and basic endpoint testing features, found at /swagger:


Swashbuckle configuration

The service description is important for two reasons:

  1. It’s an always up-to-date documentation of the service
  2. It allows for generating API clients (data contracts and methods)

For both of these use cases it’s important that the service description is both complete and correct in the details. Swashbuckle does a reasonable job of creating a service description with default settings, but there are a few behaviors that need to be overridden to get the full client experience.

XML Comments

The endpoints and data contracts are not associated with any human-readable documentation and Swashbuckle has a feature that copies all XML comments from the code into the service description so that the documentation is much more complete.

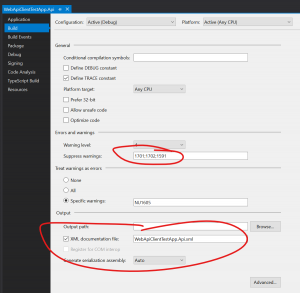
To include the comments in the service description, the comments must first be saved to an XML file during project build, so that this file can be merged with the service description. This is done in the project settings:

After the path to the XML file to create is given in the XML documentation file field, Visual Studio will start to show warning CS1591 for public methods without an XML comment. This is most likely not the preferred behavior and the warning can be turned off by adding it to the Suppress warnings field as seen in the image above.

After the file is generated then it can be referenced by Swashbuckle in the Swagger setup by using the IncludeXmlComments option. This is an example of how to compose the path to the XML file and supply it to Swashbuckle inside ConfigureServices:

            services.AddSwaggerGen(c =>
            {
                c.SwaggerDoc("v1", new OpenApiInfo { Title = "My API", Version = "v1" });

                // Set the comments path for the Swagger JSON and UI.
                var xmlFile = $"{Assembly.GetExecutingAssembly().GetName().Name}.xml";
                var xmlPath = Path.Combine(_baseFolder, xmlFile);
                c.IncludeXmlComments(xmlPath, includeControllerXmlComments: true);
            });

The field _baseFolder is set like this in the Configure method:

        public void Configure(IApplicationBuilder app, IWebHostEnvironment env)
        {
            _baseFolder = env.ContentRootPath;
            ...
        }

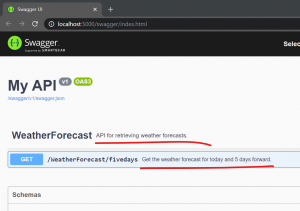
The result should look like this:


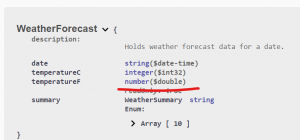
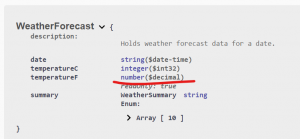
Override data types

Some data types are not correctly preserved in the service description by default, for example the decimal type found in .Net, which is commonly used in financial applications. This can be fixed by overriding the behavior for those particular types.

This is how to set the options to serialize decimal values correctly in the call to AddSwaggerGen:

                // Mark decimal properties with the "decimal" format so client contracts can be correctly generated.
                c.MapType<decimal>(() => new OpenApiSchema { Type = "number", Format = "decimal" });
                c.MapType<decimal>(() => new OpenApiSchema { Type = "number", Format = "decimal" });

(This fix is from the discussion about a bug report for Swashbuckle.)

Before:

After:


Other service adjustments

In addition to adding and configuring Swashbuckle, there are a couple of other adjustments I like to make when creating services.

Serializing enums as strings

Enums are very useful in .Net when representing a limited number of values such as states, options, modes and similar. In .Net, enum values are normally just disguised integers which is evident in Web Api responses containing enum values, since they are returned as integers with unclear interpretation. Returning integers is not that descriptive so I typically configure my services to return enum values as strings. This is easiest done by setting an option for the API controllers in the ConfigureServices method in the Startup class:

services.AddControllers()
  .AddJsonOptions(options =>
    {
        // Serialize enums as string to be more readable and decrease
        // the risk of incorrect conversion of values.
        options.JsonSerializerOptions.Converters.Add(
            new JsonStringEnumConverter());
        });


Serializing dates as strings without time parts

In the .Net framework there is no data type for dates, so we’re normally relying on the good old DateTime also in cases where the time is irrelevant. This also means that API responses with dates often will contain time parts:

{
    "date": "2020-01-06T00:00:00+01:00",
    "temperatureC": 49,
    "temperatureF": 120,
    "summary": "Warm"
},

This is confusing and may lead to bugs because of the time zone specification part.

To fix this, we can create a Json serializer that extract the date from the DateTime value as described in this StackOverflow discussion.

public class ShortDateConverter : JsonConverter&lt;DateTime&gt;
{
  public override DateTime Read(ref Utf8JsonReader reader, Type typeToConvert, JsonSerializerOptions options)
  {
    return DateTime.Parse(reader.GetString());
  }

  public override void Write(Utf8JsonWriter writer, DateTime value, JsonSerializerOptions options)
  {
    writer.WriteStringValue(value.ToUniversalTime().ToString("yyyy-MM-dd"));
  }
}

The serializer must then be applied on the data contract properties as required:

public class WeatherForecast
{
  [JsonConverter(typeof(ShortDateConverter))]
  public DateTime Date { get; set; }
}

This is the result:

{
    "date": "2020-01-06",
    "temperatureC": 49,
    "temperatureF": 120,
    "summary": "Warm"
},

Much better. 🙂

Returning errors in a separate response type

In case of an error, information about it should be returned in a structured way just as any other content. I sometimes see added fields in the normal response types for error messages and similar but I think this is bad practice since it pullutes the data contracts with (generally) unused properties. It’s much clearer for the client if there is a specific data contract for returning errors, for example something like this:

{
  "errorMessage": "An unhandled error occurred."
}

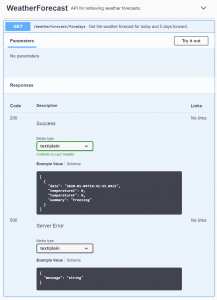
Having separate contracts for normal responses and errors requires controller actions to return different types of values depending on whether there’s an error or not, and that the Swagger service description displays information about all the required types. Luckily Swashbuckle supports this well, as long as the return types are described using the ProducesResponseType attribute.

Here’s a complete controller action where we return different classes depending on if there’s an error or not:

        [HttpGet]
        [Route("fivedays")]
        [ProducesResponseType(
          statusCode: (int)HttpStatusCode.OK,
          type: typeof(IEnumerable<WeatherForecast>))]
        [ProducesResponseType(
          statusCode: (int)HttpStatusCode.InternalServerError,
          type: typeof(ApiError))]
        public ActionResult<IEnumerable<WeatherForecast>> Get()
        {
            try
            {
                var rng = new Random();
                return Enumerable.Range(1, 5)
                    .Select(index =&amp;amp;amp;amp;amp;gt; new WeatherForecast
                    {
                        Date = DateTime.Now.AddDays(index),
                        TemperatureC = rng.Next(-20, 55),
                        Summary = GetRandomSummary(rng)
                    }).ToArray();
            }
            catch (Exception ex)
            {
                _logger.LogError(ex, "Unhandled error");
                return StatusCode(
                    (int)HttpStatusCode.InternalServerError,
                    new ApiError { Message = "Server error" });
            }
        }

The Swagger page correctly displays the different data structures used for the different status codes:


Summary

This concludes the first part in this mini-series. We now have a complete Web Api service with the following properties:

  • A Swagger description file can be found at /swagger/v1/swagger.json
  • A Swagger documentation and testing page can be found at /swagger
  • Code comments are included in the service description
  • Enums are serialized as strings
  • Dates are serializes as short dates, without time part
  • Decimal values are correctly describes in the service description

In part 2 we show how we can consume this service in a client.

/Emil


Listing remote branches with commit author and age of last commit

Here’s a simple bash script that shows how to enumerate remote Git branches:

for k in `git branch -r | perl -pe 's/^..(.*?)( ->.*)?$/\1/'`; do echo -e `git show --pretty=format:"%ci\t%cr\t%an" $k -- | head -n 1`\\t$k; done | sort -r

The resulting output looks like this:

2019-09-26 20:42:44 +0200 8 weeks ago Emil Åström origin/master
2019-09-26 20:42:44 +0200 8 weeks ago Emil Åström origin/HEAD
2019-05-17 23:06:41 +0200 6 months ago Emil Åström origin/fix/travis-test-errors
2018-04-21 23:16:57 +0200 1 year, 7 months ago Emil Åström origin/fix/nlog-levels

For a selection of other fields to include, see the git-show documentation.

(Adapted from https://stackoverflow.com/a/2514279/736684).

Capturing Alt+Tab in Citrix sessions

When using a Citrix client to access a remote computer then the Alt + Tab shortcut normally switches out of the client and selects other applications on the client machine. This is most likely not what you expect when being immersed in the remote Windows desktop session. Luckily, there’s a way to let the Citrix client capture the shortcut and switch between applications on the remote desktop:

https://support.citrix.com/article/CTX232298

For 64-bit Windows, put this into a .reg file for easy reuse:

Windows Registry Editor Version 5.00

[HKEY_LOCAL_MACHINE\SOFTWARE\WOW6432Node\Citrix\ICA Client\Engine\Lockdown Profiles\All Regions\Lockdown\Virtual Channels\Keyboard]
"TransparentKeyPassthrough"="Remote"

Execute the .reg file and restart the Citrix client and you should be good to go.

Note that this setting may be reset when updating the Citrix client so it may have to be reapplied afterwards (hence the use a of .reg file rarther manuall editing the registry).

Related tip

If you experience blurry text in the remote desktop, then this tip might help: https://lazyadmin.nl/it/citrix-receiver-blurry-in-windows-10/

/Emil

Visual Studio Code configuration tips

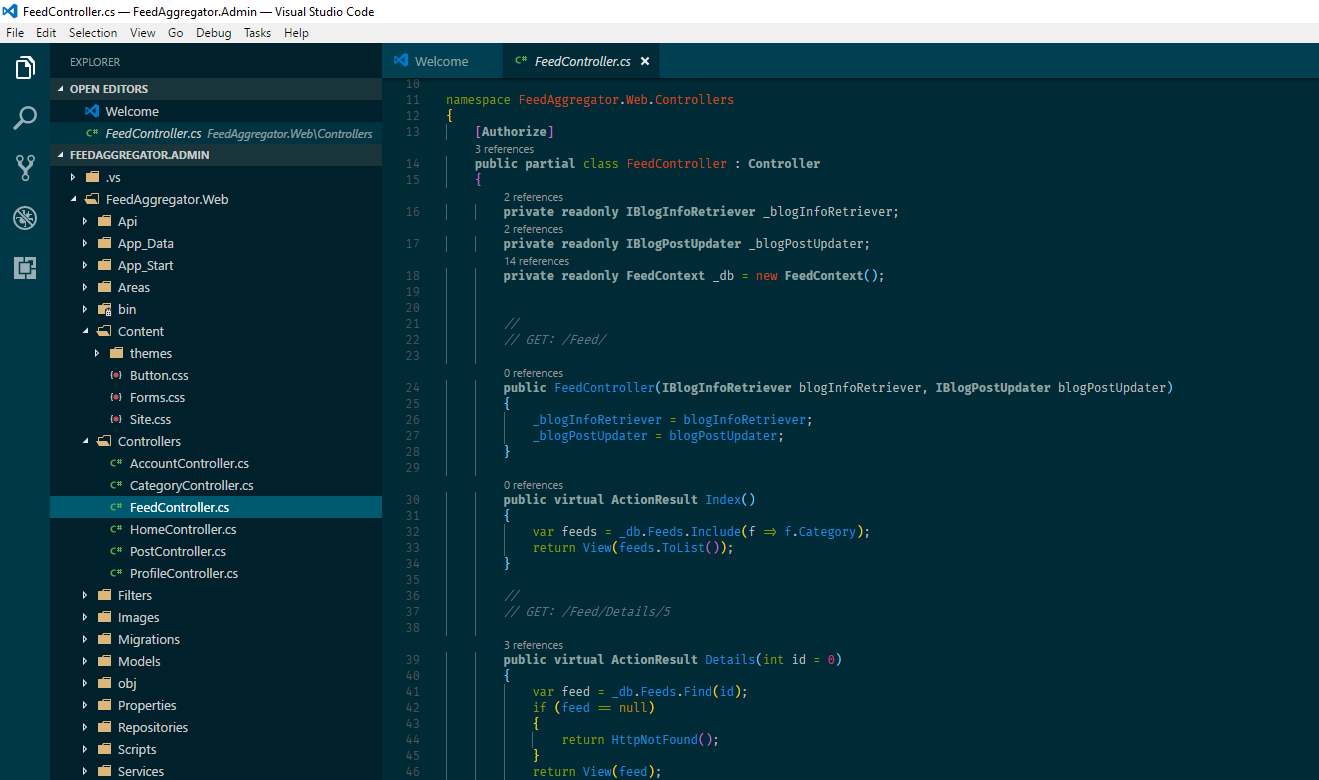
These days I tend to leave Visual Studio more and more often for doing simpler things that don’t require the full power of Visual Studio’s development tools like IntelliSense, the powerful debugging tools and ReSharper refactorings. My preferred text editor for the more light-weight work has become Visual Studio Code which, despite the name, does not have anything to do with Visual Studio. Except that it’s Microsoft that is behind it (their marketing department no doubt had some influence in the naming process). Just like in the Visual Studio case, I cannot help myself from meddling with the configuration options, so I though it might be a good idea to write down what I have done.

Color theme

Just like for Visual Studio, I’m using Solarized Dark and switching to that is easy since it’s built in into Code (File/Preferences/Color Theme).

What might be less well-known is that a new feature was recently added that allows for overriding the colors of the selected theme, namely the editor.tokenColorCustomizations setting. It works like this:

First investigate what TextMate scope it is you want to change color for. A TextMate scope is just an identifier which is normally associated with a regular expression that defines the character pattern for the scope. Since most language extensions in Visual Studio Code define scopes with the standardized identifiers for comments, strings, etc, all languages can be consistently colored by the color theme (a comment in C# looks the same as a comment in Javascript). By the way, TextMate is a text editor for Mac that first defined the syntax used for language support in Visual Studio Code (it’s also used in for example Sublime Text).To find the name of the token to change, do the following:

  1. Place the cursor on an item whose color should be changed (e.g. a comment)
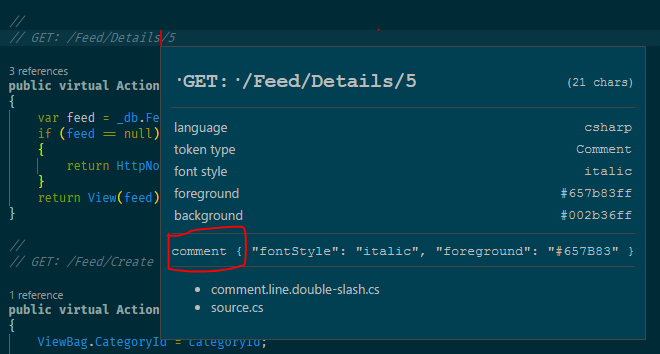
  2. Open the command palette by pressing Ctrl + Shift + P and then type Developer: Inspect Editor Tokens and Scopes (was previously called “Developer: Inspect TM Scopes“).
  3. A window opens, showing information about the current scope:In this case it’s comment. Moving the cursor will update the scope information in the window. Close it with the Esc key.
  4. To override the appearance of the identified scope, use the editor.tokenColorCustomizations setting:
    "editor.tokenColorCustomizations": {
        "textMateRules": [
            {
                "scope": "comment",
                "settings": {
                    "foreground": "#af1f1f",
                    "fontStyle": "bold"
                }
            }
        ]
    }
    
  5. Saving the settings files makes it take effect immediately, without restarting the editor. In addition to foreground color, it is also possible to set the the font style to “bold”, “italic”, “underline” or a combination.

You can also override colors in the editor UI framework using the workbench.colorCustomizations setting but I won’t cover that here. Microsoft has some good documentation of what can be done.

Visual Studio Code Extensions

The above takes care of the basic color highlighting of files but I also use a few extensions for Visual Studio Code that I feel are worthy of mentioning in a post like this.

Bracket Pair Colorizer

Adds the rainbow parenthesis feature to Visual Studio Code (matching parentheses and brackets have the same color which is different from the colors used by nested parentheses). It works really well and has configurable colors.

More info here.

Color Highlight

Visualized web color constants in source code. Very useful for all sorts of work, not just web. It’s also enabled in user settings, for example, so you can get a preview of colors when modifying the currrent theme colors 😉

More info here.

Log File Highlighter 

This extension is actually written by yours truly and is used for visualizing different items in log files, such as dates, strings, numbers, etc.

By default it associates with the .log file extension but it can be configured for other files types as well. It’s also easy to temporarily switch to the log file format by pressing Ctrl + K, M and the type Log File in the panel that opens.

More info here.

Nomo Dark Icon Theme

This extension adds really nice icons to the folder view in Visual Studio Code. It looks much better with this installed.

More info here.

Sort-lines

Sort lines is a little extension that has nothing to do with colors but I think it’s worth mentioning it anyway since I find it very useful from time to time. It adds several commands for sorting text, the one that is a bit unique is called Sort lines (unique). What it does is to sort the selected lines and remove all duplicates. very useful for aggregating data from data queries, log files etc.

More info here.

Roaming settings with symbolic links and DropBox

Once you get everything configured the way you want it, you have to repeat all the above steps on other computers you use Visual Studio Code on since it has no support for roaming user settings, which is a bit cumbersome. However, there’s an old trick that fixes that, namely to use symbolic directory link to a DropBox folder (or another similar file-sync service such as OneDrive) instead of the standard settings folder for Visual Studio Code.

To do this, follow these steps:

  1. Close Visual Studio Code if it’s open.
  2. Move the settings folder %APPDATA%\Code\User\ to somewhere in your DropBox (or OneDrive) directory tree.
  3. Create a symbolic directory link replacing the old folder with a link to its new location inside DropBox:
    mklink /d %APPDATA%\Code\User\ "C:\Users\easw3p\Dropbox\Shared\VS Code\AppData_Code_User"
    

    (adjust the DropBox path so it matches your setup).

  4. Start Visual Studio Code again to verify that everything works.

On all other machines that should use the same settings, just remove the default settings folder and create the symbolic link like shown above, and all settings should be synchronized across all machines. As a bonus, you have just enabled version controlled settings since it’s easy DropBox to show file histories and roll back changes in DropBox.

And with that I’ll end this post. Feel free to add suggestions or comment on the above 🙂

/Emil

Visual Studio configuration tips

This post describes how I have configured Visual Studio (2017 is the current version) to look and behave the way I want it to. Writing it down makes it easier for me to repeat the setup the next time I install Visual Studio on a new computer, but maybe someone else will find it useful as well.

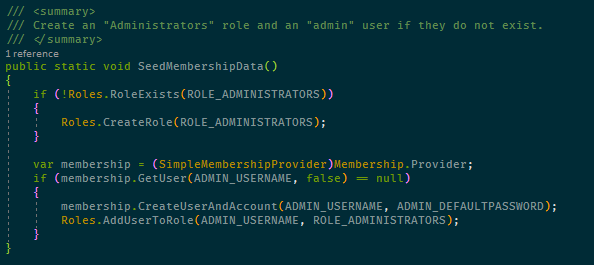
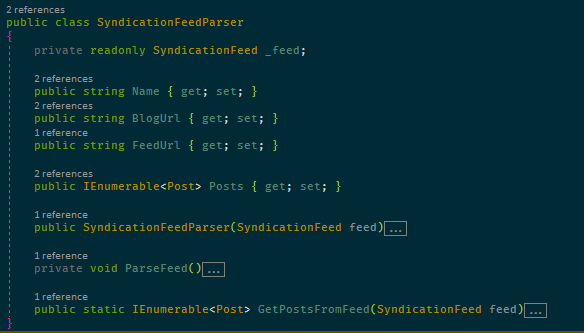
This is how a fragment of C# looks in my Visual Studio:

Color Theme

For years I have been using a color theme called Solarized Dark, of which there are many versions on the web and for many editors. I have modified a few colors but I think (but am not sure anymore) that the version I started with is this one: https://studiostyl.es/schemes/solarized-dark

I have exported my Fonts and Colors setting in Visual Studio to make them easy to reinstall, and this also includes the customized ReSharper colors (see below). Download here and use the Tools/Import and Export Settings… option in Visual Studio.

Font

The font I use is called Fira Code and supports programming ligatures which means that some combinations of characters are shown as custom symbols, such as in the lamba expression in this code fragment:

Fira Code can be downloaded directly from its GitHub repository: https://github.com/tonsky/FiraCode

Install it into Windows by downloading the contents of the distr/ttf folder and install the different variants of the font by right-clicking on them in the File Explorer and select Install in the context menu. Then go to Visual Studio’s Tools/Options menu option, to Environment/Fonts and Colors and select the font you want. I use the Fira Code Medium variant as it looked the best on my monitor.

Visual Studio Extensions

Setting the color theme and the font is still not enough to get the Visual Studio look the way I want. To go the whole way I also need two Visual Studio extensions: ReSharper and Viasfora.

ReSharper

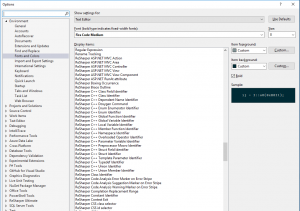
If you’re using Visual Studio for any serious work, chances are you’re already using ReSharper because of its very powerful coding tools such as the code suggestions and refactoring features. It also extends Visual Studio’s syntax highlighting with many more coloring rules. This can be seen in the Fonts and Colors dialog where these colors can be customized:

However, the coloring rules are not used unless ReSharper’s syntax coloring is enabled, as it’s disabled by default. The reason for this is probably that it does affect editing performance a little but if you have a powerful machine I think it’s worth enabling them. Not doing this leaves you with something like this:

Compared to the example at the beginning of this post there are differences in that constants and methods are not colored, which I think they should be.

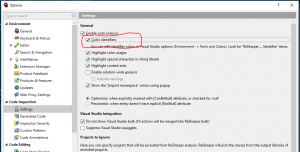
To enable the feature, go to ReSharper options and find the Code Inspection/Settings page and enable Color identifiers:

Since you’re already in ReSharper settings, you might also find it useful to enable the Use CamelHumps setting in Environment/Editor/Editor behavior. This is a feature which changes the definition of word delimiters when editing so that when moving the cursor to the next or previous word (Ctrl + Right/Left Arrow), it stops at upper case characters in camel cased symbols. Very useful for moving into long symbol names if you need to change something in the middle of them.

Viasfora

Viasfora is a fairly recent acquaintance of mine and I have found it useful to add the final coloring behaviors I want:

  • Rainbow parenthesis
    I didn’t know I needed it before I saw it, but now I find it very useful to have parenthesis and bracket pairs to have matching colors which are different from the colors of nested parentheses. Makes it much easier to see parenthesis mistakes when writing code. Visasfora has this feature and the colors it uses are customizable too.
  • Customizable colors for some keywords
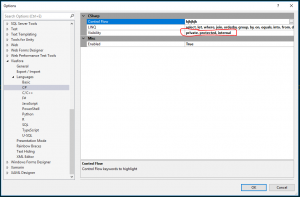
    It has for quite some time disturbed me that all visibility keywords in C# are colored the same. I really need private and public to be colored differently to make it easier to see the exposed surface of a class. Viasfora doesn’t exactly have this feature, but it does its own keyword coloring which will override Visual Studio’s built-in coloring. And its list of keywords is editable, so I can for example remove all keywords that I don’t want Viasfora to color and then set the color it uses to a discrete gray:

    This is the result and as you can see, it’s very easy to see the difference between public and private members:

Final comments

A lot of the above has to do with aesthetics but I don’t think it’s only about making the editing experience “look good”, which anyway is rather subjective. I firmly believe in minimizing the mental energy spent on interpreting and understanding code so that more energy can be put into solving the actual problems. With the changes above, I don’t have too look up symbols to see if they’re constants or enums or variables and it’s easy to see what methods are public. I think this makes me a little bit faster and my code a little bit better. That it’s nicer to look at the code is a bonus 🙂

Good luck with fiddling with configuration on your own, and feel free to post suggestions in the comments. Improving the development experience is a task I never expect to finish so new ideas are always welcome!

/Emil

Uninstalling McAfee LiveSafe

I recently bought a new computer and as usual there was quite a bit of unwanted software on it, such as McAfeee LiveSafe anti-virus software. Getting rid of it proved near impossible, using normal Windows uninstall procedures resulted in strange error messages and there were services, registry entries and McAfee folders in many places so manual deletion was not really an option either.

Luckily, McAfee has created a utility for uninstalling their software, named McAfee Consumer Product Removal, MCPR. If find it interesting that a separate tool was developed for something so basic as uninstalling the product, but at least it worked. I’m writing this small post to remind myself of it the next time I need it, but maybe someone else will find it useful as well…

The tool is described and can be downloaded here: https://service.mcafee.com/webcenter/portal/cp/home/articleview?articleId=TS101331

/Emil

Generating semantic version build numbers in Teamcity

Background

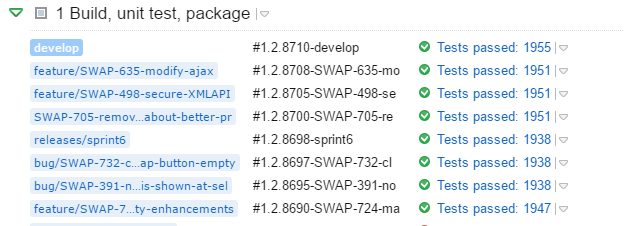
This is what we want to achieve, build numbers with minor, major and build counter parts together with the branch name.

This is what we want to achieve, build numbers with minor, major and build counter parts together with the branch name.

What is a good version number? That depends on who you ask I suppose, but one of the most popular versioning schemes is semantic versioning. A version number following that scheme can look like the following:

1.2.34-beta

In this post I will show how an implementation for generating this type of version numbers in Teamcity with the following key aspects:

  1. The major and minor version numbers (“1” and “2” in the example above) will be coming for the AssemblyInfo.cs file.
    • It is important that these numbers come from files in the VCS repository (I’m using Git) where the source code is stored so that different VCS branches can have different version numbers.
  2. The third group (“34”) is the build counter in Teamcity and is used to separate different builds with the same major and minor versions from each other.
  3. The last part is the pre-release version tag and we use the branch name from the Git repository for this.
    • We will apply some filtering and formatting for our final version since the branch name may contain unsuitable characters.

In the implementation I’m using a Teamcity feature called File Content Replacer which was introduced in Teamcity 9.1. Before this we we had to use another feature called Assembly Info Patcher but that method had several disadvantages, mainly that there was no easy way of using the generated version number in other build steps.

In the solution described below, we will replace the default Teamcity build number (which is equal to the build counter) with a custom one following the version outlined above. This makes it possible to reuse the version number everywhere, e.g. in file names, Octopus Release names, etc. This is a great advantage since it helps make connect everything produced in a build chain together (assemblies, deployments,  build monitors, etc).

Solution outline

The steps involved to achieve this are the following:

  1. Assert that the VCS root used is properly configured
  2. Use the File Content Replacer to update AssemblyInfo.cs
  3. Use a custom build step with a Powershell script to extract the generated version number from AssemblyInfo.cs, format it if needed, and then tell Teamcity to use this as the build number rather than the default one
  4. After the build is complete, we use the VCS Labeling build feature to add a build number tag into the VCS

VCS root

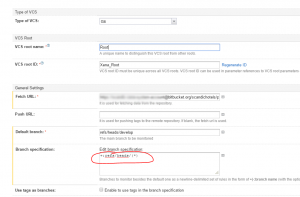
The first step is to make sure we get proper branch names when we use the Teamcity %teamcity.build.branch% variable. This will contain the branch name from the version control system (Git in our case) but there is a special detail worth mentioning, namely that the branch specification’s wildcard part should be surrounded with parentheses:

VCS root branch specification with parenthesis.

VCS root branch specification with parenthesis.

If we don’t do this, then the default branch (“develop” in this example) will be shown as <default> which is not what we want. The default branch should be the name branch name just like every other branch, and adding the parentheses ensures that.

Updating AssemblyInfo.cs using the File Content Replacer build feature

In order for the generated assembly to have the correct version number we update the AssemblyInfo.cs before building it. We want to update the following two lines:


[assembly: AssemblyVersion("1.2.0.0")]
[assembly: AssemblyFileVersion("1.2.0.0")]

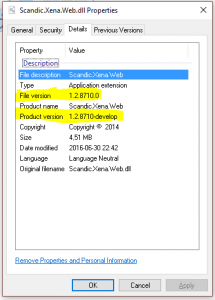
The AssemblyVersion attribute is used to generate the File version property of the file and the AssemblyFileVersion attribute is used for the Product version.

File version and product version of the assembly.

File version and product version of the assembly.

We keep the first two integers to use them as major and minor versions in the version number. Note that the AssemblyVersion attribute has restriction on it so that it must be four integers separated by dots, while AssemblyFileVersion does not have this restriction and can contain our branch name as well.

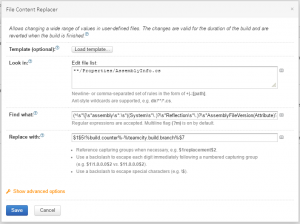
To accomplish the update, we use the File Content Replacer build feature in Teamcity two times (one for each attribute) with the following settings:

AssemblyVersion

  • Find what:
    (^\s*\[\s*assembly\s*:\s*((System\s*\.)?\s*Reflection\s*\.)?\s*AssemblyVersion(Attribute)?\(")([0-9\*]+\.[0-9\*]+\.)([0-9\*]+\.[0-9\*]+)("\)\])$
  • Replace with:
    $1$5\%build.counter%$7

AssemblyFileVersion

  • Find what:
    (^\s*\[\s*assembly\s*:\s*((System\s*\.)?\s*Reflection\s*\.)?\s*AssemblyFileVersion(Attribute)?\(")([0-9\*]+\.[0-9\*]+\.)([0-9\*]+\.[0-9\*]+)("\)\])$
  • Replace with:
    $1$5\%build.counter%-%teamcity.build.branch%$7

As you can see, the “Find what” parts are regular expressions that finds the part of AssemblyInfo.cs that we want to update and “Replace with” are replacement expressions in which we can reference the matching groups of the regex and also use Teamcity variables. The latter is used to insert the Teamcity build counter and the branch name.

In our case we keep the first two numbers but if the patch number (the third integer) should also be included, then these two expressions can be adjusted to accomodate for this.

The FIle Content Replacer build feature in Teamcity.

The FIle Content Replacer build feature in Teamcity.

When we have done the above, the build will produce an assembly with proper version numbers, similarly to what we could accomplish with the old Assembly Info Patcher, but the difference with the old method is that we now have an patched AssemblyInfo.cs file whereas with the old method it was unchanged as only the generated assembly DLL file was patched. This allows us to extract the generated version number in the next step.

Setting the Teamcity build number

Up to now, the Teamcity build number has been unchanged from the default of being equal to the build counter (a single integer, increased after every build). The format of the build number is set in the General Settings tab of the build configuration.

The General Settings tab for a build configuration.

The General Settings tab for a build configuration.

The build number is just a string uniquely identifying a build and it’s displayed in the Teamcity build pages and everywhere else where builds are displayed, so it would be useful to include our full version number in it. Doing that also makes it easy to use the version number in other build steps and configurations since the build number is always accessible with the Teamcity variable %system.build.number%.

To update the Teamcity build number, we rely on a Teamcity service message for setting the build number. The only thing we have to do is to make sure that our build process outputs a string like the following to the standard output stream:

##teamcity[buildNumber '1.2.34-beta']

When Teamcity sees this string, it will update the build number with the supplied new value.

To output this string, we’re using a separate Powershell script build step that extracts the version string from the AssemblyInfo.cs file and does some filtering and truncates it. The latter is not strictly necessary but in our case we want the build number to be usable as the name of a release in Octopus Deploy so we format it to be correct in that regard, and truncate it if it grows beyond 20 characters in length.

Build step for setting the Teamcity build number

Build step for setting the Teamcity build number

The actual script looks like this (%MainAssemblyInfoFilePath% is a variable pointing to the relative location of the AssemblyInfo.cs file):

function TruncateString([string] $s, [int] $maxLength)
{
	return $s.substring(0, [System.Math]::Min($maxLength, $s.Length))
}

# Fetch AssemblyFileVersion from AssemblyInfo.cs for use as the base for the build number. Example of what
# we can expect: "1.1.82.88-releases/v1.1"
# We need to filter out some invalid characters and possibly truncate the result and then we're good to go.  
$info = (Get-Content %MainAssemblyInfoFilePath%)

Write-Host $info

$matches = ([regex]'AssemblyFileVersion\(\"([^\"]+)\"\)').Matches($info)
$newBuildNumber = $matches[0].Groups[1].Value

# Split in two parts:  "1.1.82.88" and "releases/v1.1"
$newBuildNumber -match '^([^-]*)-(.*)$'
$baseNumber = $Matches[1]
$branch = $Matches[2]

# Remove "parent" folders from branch name.
# Example "1.0.119-bug/XENA-5834" =&amp;amp;amp;gt; "1.0.119-XENA-5834"
$branch = ($branch -replace '^([^/]+/)*(.+)$','$2' )

# Filter out illegal characters, replace with '-'
$branch = ($branch -replace '[/\\ _\.]','-')

$newBuildNumber = "$baseNumber-$branch"

# Limit build number to 20 characters to make it work with Octopack
$newBuildNumber = (TruncateString $newBuildNumber 20)

Write-Host "##teamcity[buildNumber '$newBuildNumber']"

(The script is based on a script in a blog post by the Octopus team.)

When starting a new build with this build step in it, the build number will at first be the one set in the General Settings tab, but when Teamcity sees the output service message, it will be updated to our version number pattern. Pretty nifty.

Using the Teamcity build numbers

To wrap this post up, here’s an example of how to use the updated build number to create an Octopus release.

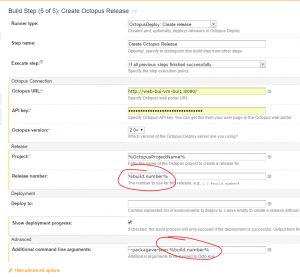
Creating an Octopus release with proper version number from within Teamcity.

Creating an Octopus release with proper version number from within Teamcity.


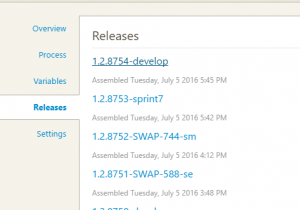
In Octopus, the releases will now have the same names as the build numbers in Teamcity, making it easy to know what code is part of the different releases.

The releases show up in Octopus with the same names as the build number in Teamcity.

The releases show up in Octopus with the same names as the build number in Teamcity.

Tagging the VCS repository with the build number

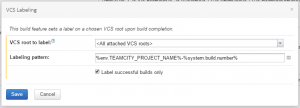
The final step for adding full tracability to our build pipeline is to make sure that successful builds adds a tag to the last commit included in the build. This makes it easy in the VCS to know exactly what code is part of a given version, all the way out to deployed Octopus releases. This is very easy to accomplish using the Teamcity VCS labeling build feature. Just add it to the build configuration with values like in the image below, and tags will created automatically everytime a build succeeds.

The VCS Labeling build feature in Teamcity.

The VCS Labeling build feature in Teamcity.

The tags show up in Git like this:

Tags in the Git repository connects the versions of successful builds with the commit included in the build.

Tags in the Git repository connects the versions of successful builds with the commits included in the build.

Mission accomplished.

/Emil

Debugging a memory leak in an ASP.Net MVC application

Background

We recently had a nasty memory leak after deploying a new version of a project I’m involved in. The new version contained 4 months of changes compared to the previous version and because so many things had changed it was not obvious what caused the problem. We tried to go through all the changes using code compare tools (Code Compare is a good one) but could not find anything suspicious. It took us about a week to finally track down the problem and in this post I’ll write down a few tips that we found helpful. The next time I’m having a difficult memory problem I know where to look, and even if this post is a bit unstructured I hope it contains something useful for other people as well.

.Net memory vs native memory

The first few days we were convinced that we had made a logical error or had made some mistakes in I/O access. We also suspected that our caching solutions had gone bad, but it was hard to be sure. We used Dynatrace to get .Net memory dumps from other environments than our production environment which has zero downtime requirements. We also used a memory profiler (dotMemory) to see if we could see any trends in memory usage one local dev machines with a crawler running, but nothing conclusive could be found.

Then we got a tip to have a look at a few Windows performance counters that can help track down this kind of problem:

  1. Process / Private Bytes – the total memory a process has allocated (.Net and native combined)
  2. .NET CLR Memory / # Bytes in all Heaps – the memory allocated for .Net objects

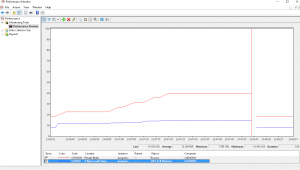
We added these two for our IIS application pool process (w3p.exe) and it turned out that the total memory allocations increased but that the .Net memory heap did not:

Perf counter #1

Total memory usage (red line) is increasing but the .Net memory heap allocations (blue) are not.

This means that it’s native memory that gets leaked and we could rule out our caching and other .Net object allocations.

What is allocated?

So we now knew it was native memory that was consumed, but not what kind of memory.

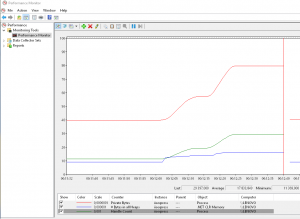
One classic type of memory leak is to not release files and other I/O objects properly and we got another tip for how to check for that, namely to add the Process / Handle Count performance counter. Handles are small objects used to reference different types of Windows objects, such as files, registry items, window items, threads, etc, etc, so it’s useful to see if that number increases. And it did:

The handle count (green) followed the increase memory usage very closely.

The handle count (green) followed the increased memory usage very closely.

By clicking on a counter in the legend we could see that the number of active handles increased to completely absurd levels, a few hours after an app pool recycle we had 2-300 000 active handles which definitely indicates a serious problem.

What type of handles are created?

The next step was to try to decide what type of handles were created. We suspected some network problem but were not sure. We then find out about this little gem of a tool: Sysinternals Handle. It’s a command line tool that can list all active handles in a process and to function properly it must be executed with administrative privileges (i.e. start the Powershell console with “Run as Administrator”). It also has a handy option to summarize the number of handles of each type which we used like this:

PS C:\utils\Handle> .\Handle.exe -p 13724 -s

Handle v4.0
Copyright (C) 1997-2014 Mark Russinovich
Sysinternals - www.sysinternals.com

Handle type summary:
  ALPC Port       : 8
  Desktop         : 1
  Directory       : 5
  EtwRegistration : 158
  Event           : 14440
  File            : 226
  IoCompletion    : 8
  IRTimer         : 6
  Job             : 1
  Key             : 96
  Mutant          : 59
  Section         : 258
  Semaphore       : 14029
  Thread          : 80
  Timer           : 1
  Token           : 5
  TpWorkerFactory : 3
  WaitCompletionPacket: 15
  WindowStation   : 2
Total handles: 29401

It was obvious that we had a problem with handles of the Event and Semaphore types. To focus on just those two when experimenting we used simple PowerShell string filtering to make these two stand out better:

PS C:\utils\Handle> .\Handle.exe -p 13724 -s | select-string "event|semaphore"

  Event           : 14422
  Semaphore       : 14029

At this point we had a look again at the code changes made during the 4 months but could still not see what could be causing the problems. There was a new XML file that was accesses but that code used an existing code pattern we had and since we were looking at Event and Semaphore handles it did not seem related.

Non-suspending memory dumps

After a while someone suggested using Sysinternals Procdump to get a memory dump from the production environment without suspending the process being dumped (which happens when using the Create dump file option in Task Manager) using a command line like this:


PS C:\Utils\Procdump> .\procdump64.exe -ma 13724 -r

ProcDump v8.0 - Writes process dump files
Copyright (C) 2009-2016 Mark Russinovich
Sysinternals - www.sysinternals.com
With contributions from Andrew Richards

[00:31:19] Dump 1 initiated: C:\Utils\Procdump\iisexpress.exe_160619_003119.dmp
[00:31:20] Waiting for dump to complete...
[00:31:20] Dump 1 writing: Estimated dump file size is 964 MB.
[00:31:24] Dump 1 complete: 967 MB written in 4.4 seconds
[00:31:24] Dump count reached.


The -r option results in that a clone of the process being dumped is created so that the dump can be taken without bringing the site to a halt. We monitored the number of requests per second during the dump file creation using the ASP.NET Applications / Requests/Sec performance counter and it was not affected at all.

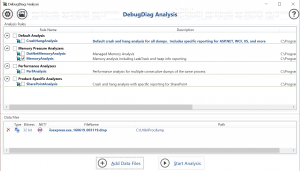
Now that we had a dump file, we analyzed it in the Debug Diagnostic Tool v2 from Microsoft. We used the MemoryAnalysis option and loaded the previously created dump under Data Files:

Using the memory analysis function on a dump file.

Using the memory analysis function on a dump file.

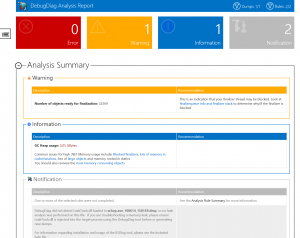
The report showed a warning about the finalize queue being very long but that did not explain very much to us, except that something was wrong with deallocating some types of objects.

Debug Diagnostic Tool report

Debug Diagnostic Tool report

There was just one warning after the memory analysis of the dump, that there were a lot of object that were not finalized.

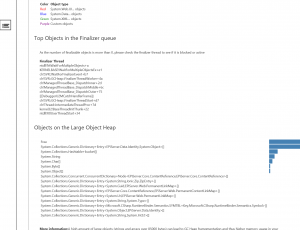
The report also contained a section about the type of object in the finalize queue:

The finalizer queue in the Debug Diagnostic Tool report

The finalizer queue in the Debug Diagnostic Tool report

The most frequent type of object in the queue is undeniably related to our Event and Semaphore handles.

The solution

The next day, one of the developers thought again about what we had changed in the code with regards to handles and again landed on the code that opened an XML file. The code looked like this:

private static IEnumerable<Country> GetLanguageList(string fileFullPath)
{
    List<Country> languages;
    var serializer = new XmlSerializer(typeof(List<Country>),
        new XmlRootAttribute("CodeList"));
    using (var reader = XmlReader.Create(fileFullPath))
    {
        languages = (List<Country>)serializer.Deserialize(reader);
        foreach (var c in languages)
            c.CountryName = c.CountryName.TrimStart().TrimEnd();
    }
    return languages;
}

It looks pretty innocent but he decided to Google “XmlSerializer memory leak”, and what do you know, the first match is a blog post by Tess Fernandez called .NET Memory Leak: XmlSerializing your way to a Memory Leak… It turns out that there is an age-old bug (there is no other way of classifying this behavior) in XmlSerializer that it will not return all memory when deallocated, for some of its constructors. This is even documented by Microsoft themselves in the docs for the XmlSerializer class, under the Dynamically Generated Assemblies heading it says:

If you use any of the other constructors, multiple versions of the same assembly are generated and never unloaded, which results in a memory leak and poor performance.

Yes, indeed it does… Since .Net Framework 1.1, it seems. It turns out we should not create new instances of the XmlSerializer class, but cache and reuse them instead. So we implemented a small cache class that handles the allocation and caching of these instances:

using System.Collections.Concurrent;
using System.Xml.Serialization;

namespace Xena.Web.Services
{
    public interface IXmlSerializerFactory
    {
        XmlSerializer GetXmlSerializer<T>(string rootAttribute);
    }

    public class XmlSerializerFactory : IXmlSerializerFactory
    {
        private readonly ConcurrentDictionary<string, XmlSerializer> _xmlSerializerCache;

        public XmlSerializerFactory()
        {
            _xmlSerializerCache = new ConcurrentDictionary<string, XmlSerializer>();
        }

        public XmlSerializer GetXmlSerializer<T>(string rootAttribute)
        {
            var key = typeof(T).FullName + "#" + rootAttribute;

            var serializer = _xmlSerializerCache.GetOrAdd(key,
                k => new XmlSerializer(typeof (T), new XmlRootAttribute(rootAttribute)));

            return serializer;
        }
    }
}

This class has to be a singleton, of course, which was configured in our DI container StructureMap like this:

container.Configure(c => c.For(typeof(IXmlSerializerFactory)).Singleton().Use(typeof(XmlSerializerFactory)));

And finally, everything worked like a charm, with horizontal memory graphs. 🙂

Using handle.exe it was easy to verify on the developer machines that the XmlSerializerFactory actually solved the problem since the Semaphore handle count now remained constant after page views. If we only had had the memory graphs to go by, it would have taken much longer to verify the non-growing memory trend since the total memory allocations always fluctuates during execution.

/Emil

Analyzing battery health on a Windows PC

Recently, my wife’s laptop has started to exhibit shorter and shorter battery life after each full load so I suspected that it was time for exchanging the battery. But how can one be sure that replacing the battery solves the problem? Laptop batteries are not exactly cheap, the one I found for the wife’s Asus A53S costs about 50 €.

It turns out that there’s a useful command line tool built into Windows for this: powercfg.exe

PS C:\WINDOWS\system32> powercfg.exe -energy
Enabling tracing for 60 seconds...
Observing system behavior...
Analyzing trace data...
Analysis complete.

Energy efficiency problems were found.

14 Errors
17 Warnings
24 Informational

See C:\WINDOWS\system32\energy-report.html for more details.
PS C:\WINDOWS\system32> start C:\WINDOWS\system32\energy-report.html

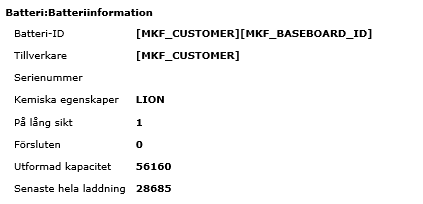
A lot of errors and warnings, apparently. Viewing the generated file reveals the details, and apart from the errors and warnings (that were mostly related to energy savings not being enabled when running on battery) there was this interesting tidbit of information:

powercfg_output

This is in obviously in Swedish, in English the labels would be Design Capacity 56160 and Last Full Charge 28685, so it seems that the battery cannot be loaded to its full capacity anymore, but rather about half of it. Seem it’s indeed time for a new battery.

/Emil

(I wrote this post to remind myself of this useful utility. I did by the way buy a new battery and now battery life is back to normal.)