
I was recently approached by a representative from Devart who asked if I wanted to have a look at some of their products, so I decided to try out the LINQ Insight add-in for Visual Studio.
LINQ Insight has two main functions:
- Profiler for LINQ expressions
- Design-time LINQ query analyzer and editor
If you work much with LINQ queries you probably know that Visual Studio is somewhat lacking with functionality around LINQ queries by default so the functions that LINQ Insight offers should be pretty welcome for any database developer out there on the .Net platform (which should be pretty many of us these days). Let’s discuss the two main features of LINQ Insight in some more detail.
Profiling LINQ queries
If you’re using Entity Framework (LINQ Insight apparently also supports NHibernate, RavenDB, and a few others but I have not tested any of those) and LINQ it can be a little difficult to know exactly what database activity occurs during the execution of the applications. After all, the main objective of OR mappers is to abstract away the details of the database and instead let the developer focus on the domain model. But when you’re debugging errors or analyzing performance it’s crucial to analyze the database activity as well, and that’s what LINQ Insight’s profiling function helps with.
There are other tools to this of course, such as IntelliTrace in Visual Studio Ultimate, but since it’s only included in Ultimate, not many developers have access to it. LINQ Insight profiler is very easy to use and gives access to a lot of information.
To enable profiling, follow these steps:
- Make sure that IIS Express process is not started. Stop it if it is. (This assumes we’re using IIS Express of course. I’m not quite sure how to work with the full IIS server in conjunction with LINQ Insight.)
- Open the profiling window by selecting View/Other Windows/LINQ Profiler, or pressing Ctrl+W, F
- Press the “Start profiler session” button in the upper left corner of the window (it looks like a small “Play” icon)
- Start debugging your application, for example by pressing F5.
- Debugging information such as this should now start to fill the profiler window:
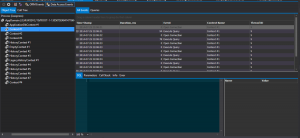
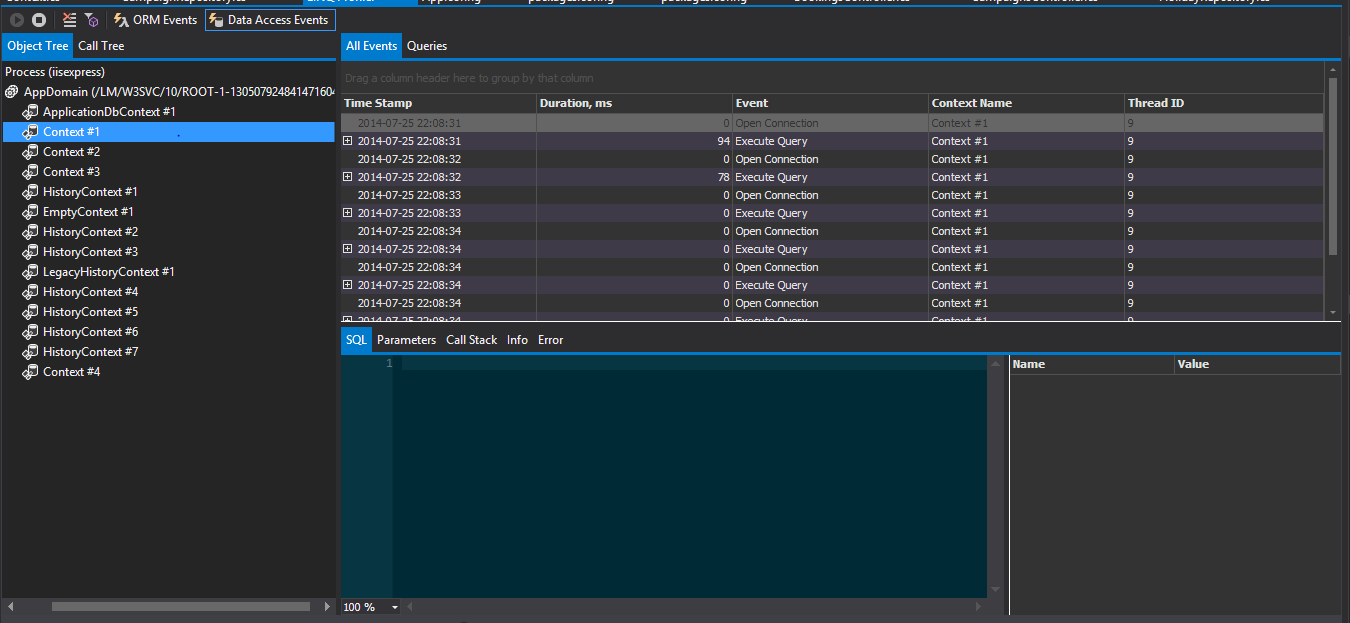
The profiler displays all LINQ activity in the application.
As you can see, in this case we have several different contexts that have executed LINQ queries. For example,
ApplicationContextis used by ASP.Net Identity andHistoryContextis used by Code First Database Migrations.Contextis our application context. - We can now drill down into the queries and see what triggered them and what SQL statements were executed.
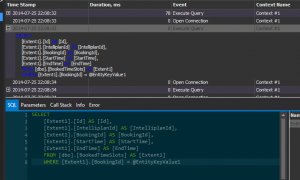
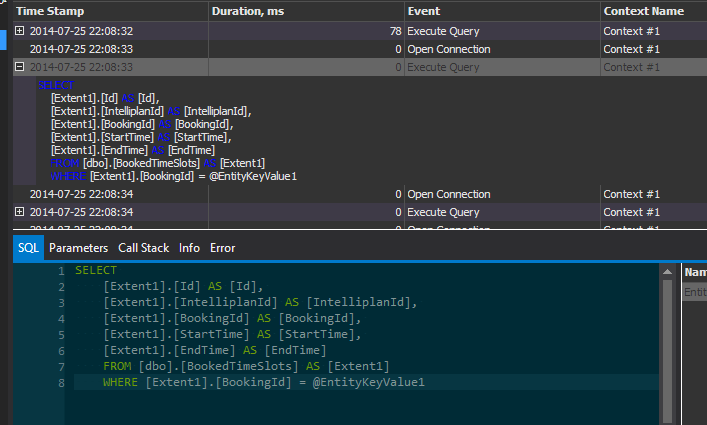
Drilling down into profiler data.
We can see the LINQ query that was executed, the SQL statements, duration, call stack, etc. Very useful stuff indeed.
Query debugger and editor
The other feature LINQ Insight brings into Visual Studio is to help writing LINQ queries and debug them. To debug a query, follow these steps:
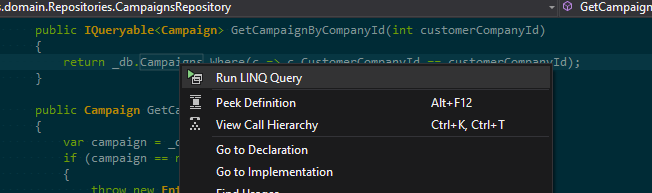
- To open a query in the query editor, just right-click on it in the standard C# code editor window and select the “Run LINQ Query” option:
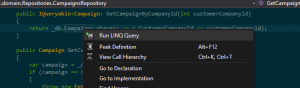
To debug or edit a LINQ query, use the right-click menu.
- If the query contains one or more parameters, a popup will be shown where values for the parameters can be given.
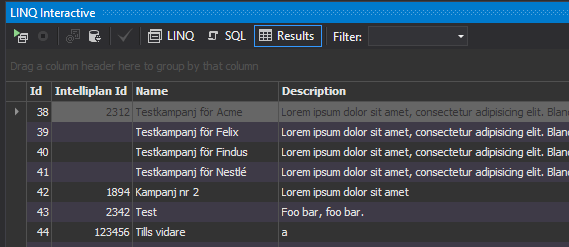
- Next, the query will be executed, and the results will be displayed:
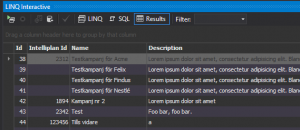
Query results are displayed in the Results tab.
- This is of course useful in itself, and even better is that the generated Sql statements are displayed in the SQL tab and the original LINQ query is in the LINQ tab, where it can be edited and re-executed, after which the Sql and Results tab are updated. Really, really useful!
If an error is displayed in the Results tab, then the most probably reason is that the database could not be found in the project’s config file, or that it could not be interpreted correctly. The latter is the case if using the LocalDB provider with the "|DataDirecory|" placeholder, which only can be evaluated at runtime in a ASP.Net project. To make LINQ Insight find a database MDF file in App_Data in a web project, you can follow these steps:
- Make sure that your DbContext sub-class (for Entity Framework, that is) has an overloaded constructor that takes a single string parameter, namely the connection string to use:
public Context(string connString) : base(connString) {}This is required if LINQ Insight cannot deduce the connection string for the project’s config file. This is usually a problem in my projects since I like to separate domain logic into a separate project (normally a class library) from my “host application”.
- Double-click the MDF file in the App_Data folder to make sure it’s present in the Server Explorer panel in Visual Studio.
- Select the database in the Server Explorer and right-click it and select Properties. Copy its Connection String property.
- In the LINQ Interactive window, click the Edit Connection String button, which is only enabled if the DbContext class has a constructor overload with a connection string parameter, which we ensured in step 1.
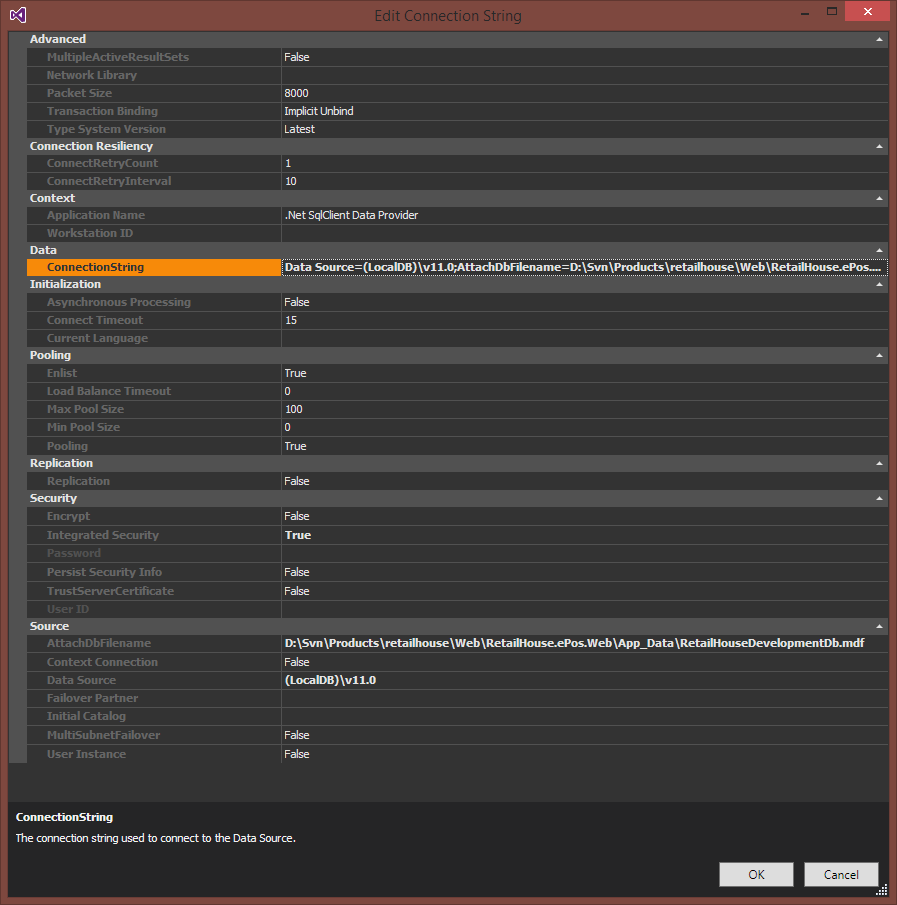
- Paste the connection string to the Data/ConnectionString field in the panel:
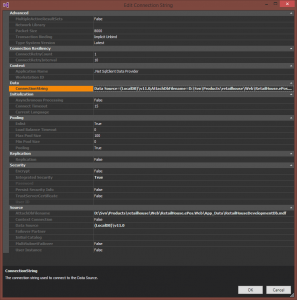
Use the connection string dialog to override the “guessed” connection string.
Click OK to close the dialog.
- Re-run the query with the Run LINQ Query button in the LINQ Interactive window, and it should now work correctly. If it doesn’t, try to Run LINQ Query command in the C# code editor again, since it re-initializes the query.
The ability to freely set the connection string should make it possible to work against any database, be it a local MDF file, a full SQL Server database or a Windows Azure database. This could be used as a simple way to try out new or modified LINQ queries against a staging or production database, right from the development enviroment. Could be very useful in some situations for debugging nasty errors and such.
Summary
All in all, I think the LINQ Insight is a very useful tool and I recommend you try it out if you find yourself writing LINQ queries from time to time.
I should also mention that if you have tried LINQ Insight before and found it be slightly unstable then I should mention that Devart have recently fixed a few errors that really makes the tool much more robust and useful. If unsure, just download the trial version and test it out.
Happy Linqing!
Emil