This is the first part of a two-post series about creating a Web API REST service written in ASP.Net Core and consuming it using the NSwag toolchain to automatically generate the C# client code. This way of consuming a web service puts some requirements on the OpenAPI definition (previously known as Swagger definition) of the service so in this first part I’ll describe hot to properly set up a service so it can be consumed properly using NSwag.
The second part shows how to generate client code for the service.
Example code is available on GitHub.
Swashbuckle
When a new Web Api project (this post describes Asp.Net Core 3.0) is created in Visual Studio, it contains a working sample service but the code is missing a few crucial ingredients.
The most notable omission is that the service is missing an OpenAPI service description (also known as a Swagger description). On the .Net platform, such a service description is usually created automatically based on the API controllers and contracts using the Swashbuckle library.
This is how to install it and enable it in Asp.Net Core:
- Add a reference to the Swashbuckle.AspNetCore Nuget package (the example code uses version 5.0.0-rc5).
- Add the following to
ConfigureServices(IServiceCollection services)in Startup.cs:services.AddSwaggerGen(c => { c.SwaggerDoc("v1", new OpenApiInfo { Title = "My API", Version = "v1" }); }); - Also add these lines to
Configure(IApplicationBuilder app, IWebHostEnvironment env)in the same file:app.UseSwagger(); app.UseSwaggerUI(c => { c.SwaggerEndpoint($"/swagger/v1/swagger.json", ApiName); });
The first call enable the creation of the service description file and the second enables the UI for showing the endpoints with documentation and basic test functionality.
After starting the service, the description is available at this adress: /swagger/v1/swagger.json
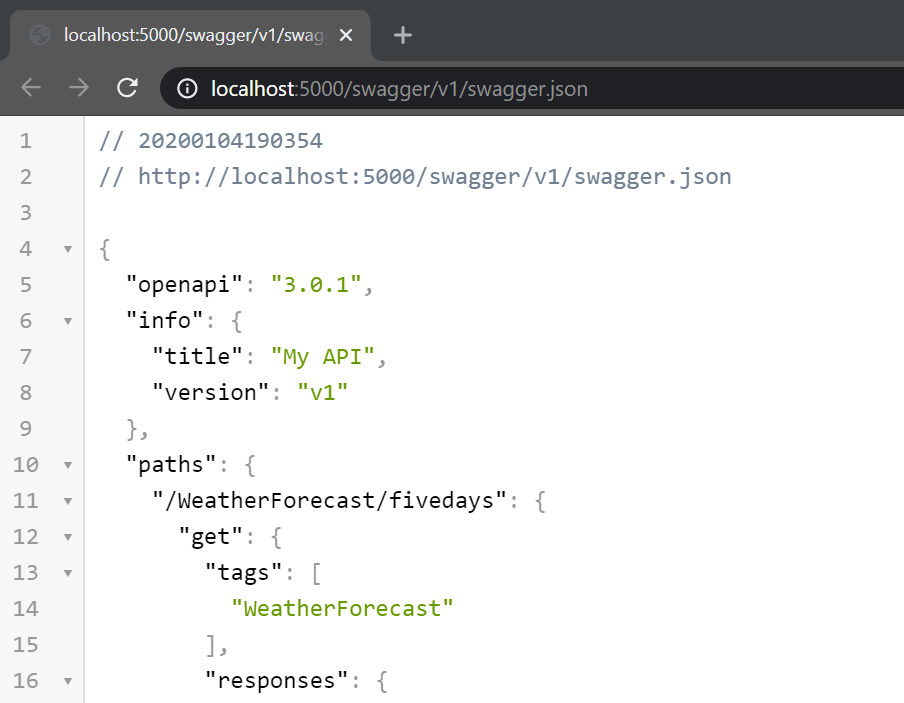
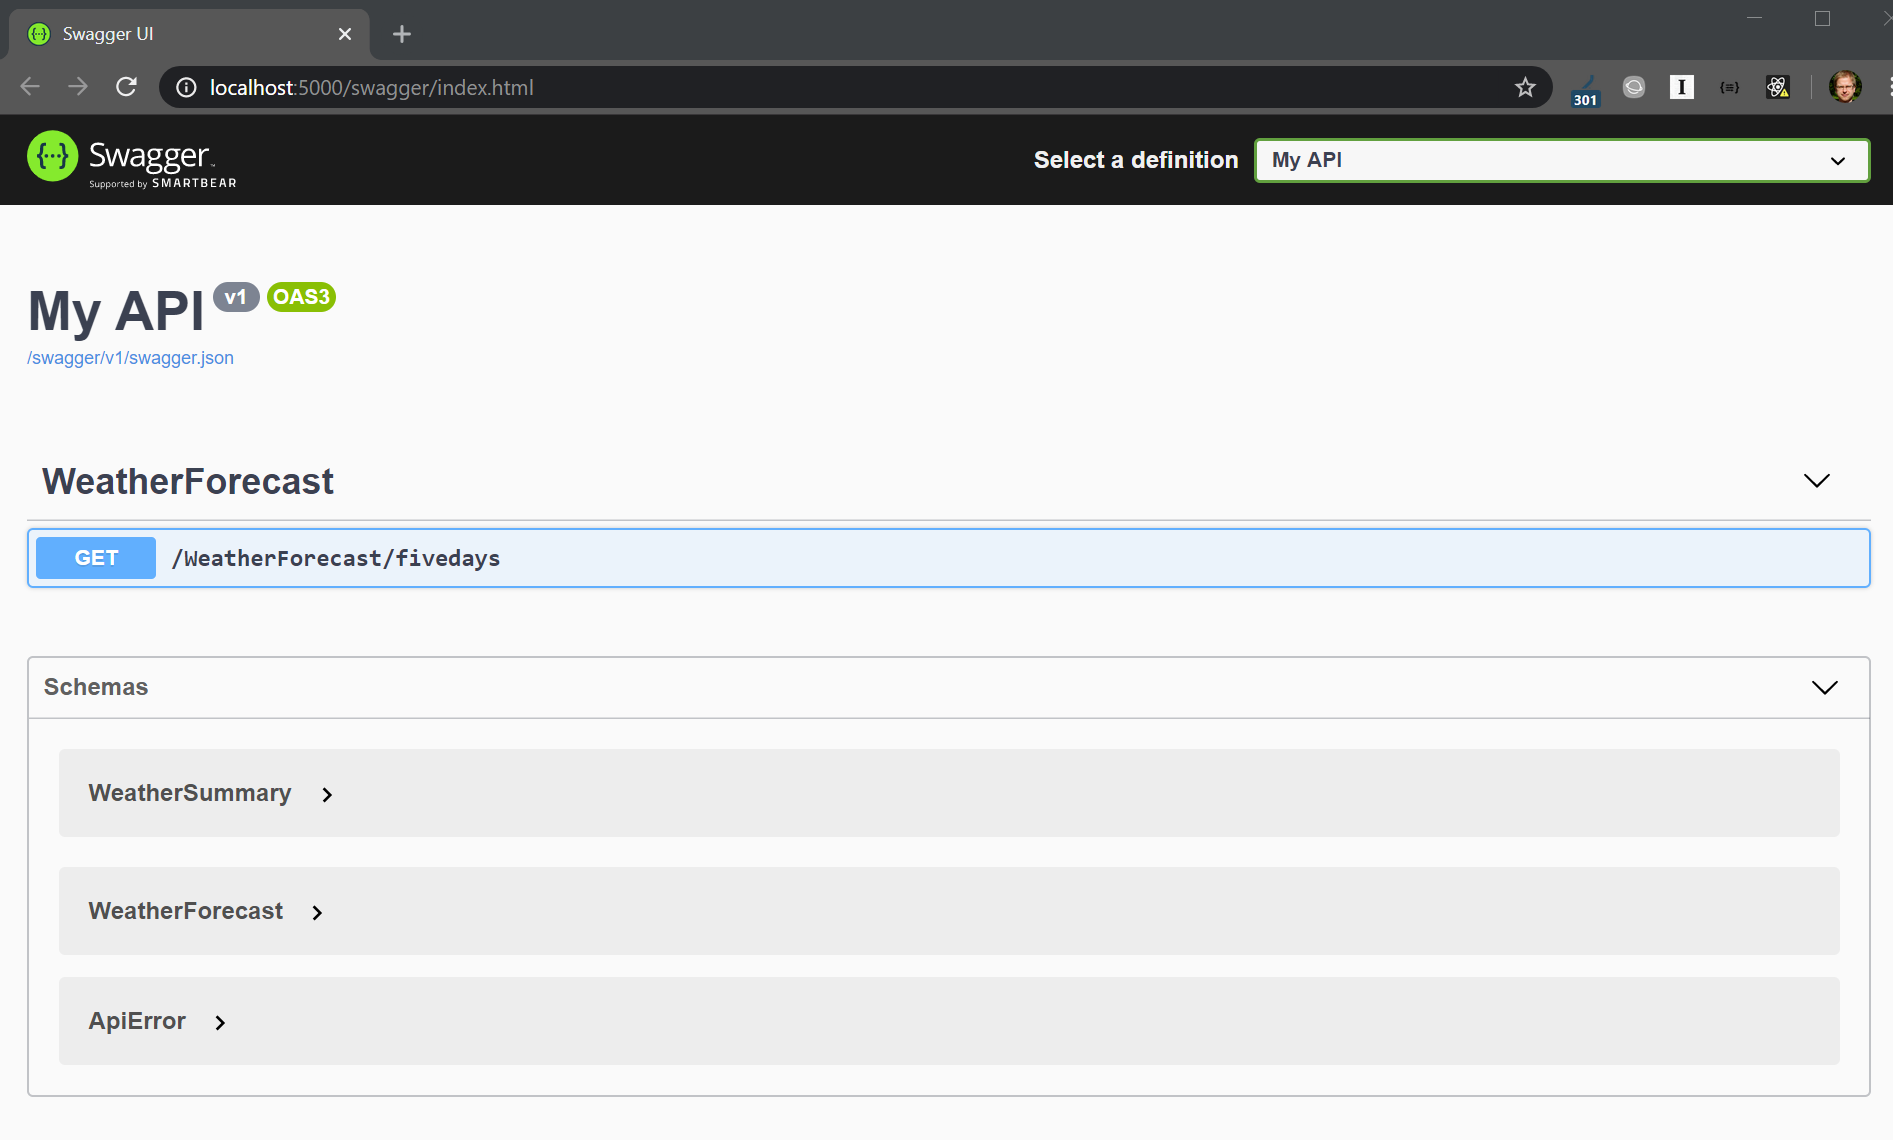
More useful than this is the automatically created Swagger UI with documentation and basic endpoint testing features, found at /swagger:
Swashbuckle configuration
The service description is important for two reasons:
- It’s an always up-to-date documentation of the service
- It allows for generating API clients (data contracts and methods)
For both of these use cases it’s important that the service description is both complete and correct in the details. Swashbuckle does a reasonable job of creating a service description with default settings, but there are a few behaviors that need to be overridden to get the full client experience.
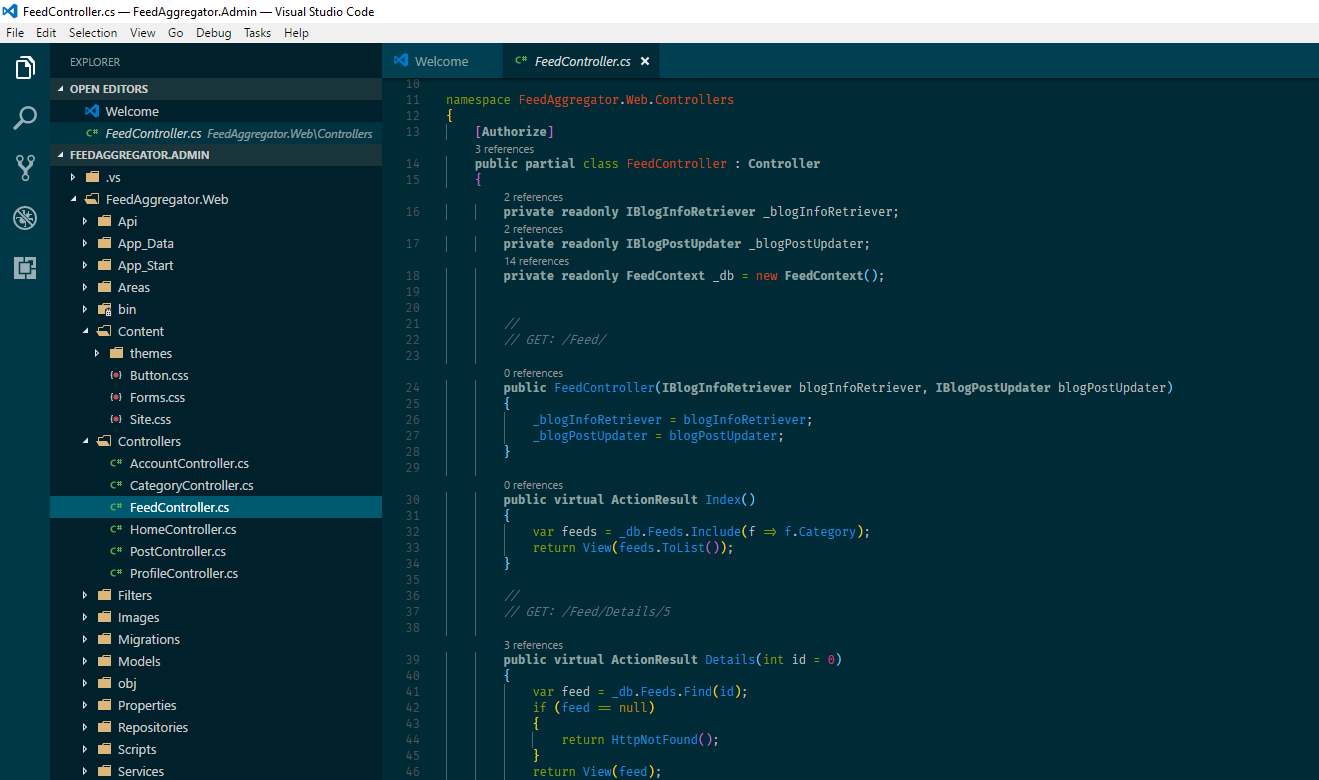
XML Comments
The endpoints and data contracts are not associated with any human-readable documentation and Swashbuckle has a feature that copies all XML comments from the code into the service description so that the documentation is much more complete.
To include the comments in the service description, the comments must first be saved to an XML file during project build, so that this file can be merged with the service description. This is done in the project settings:
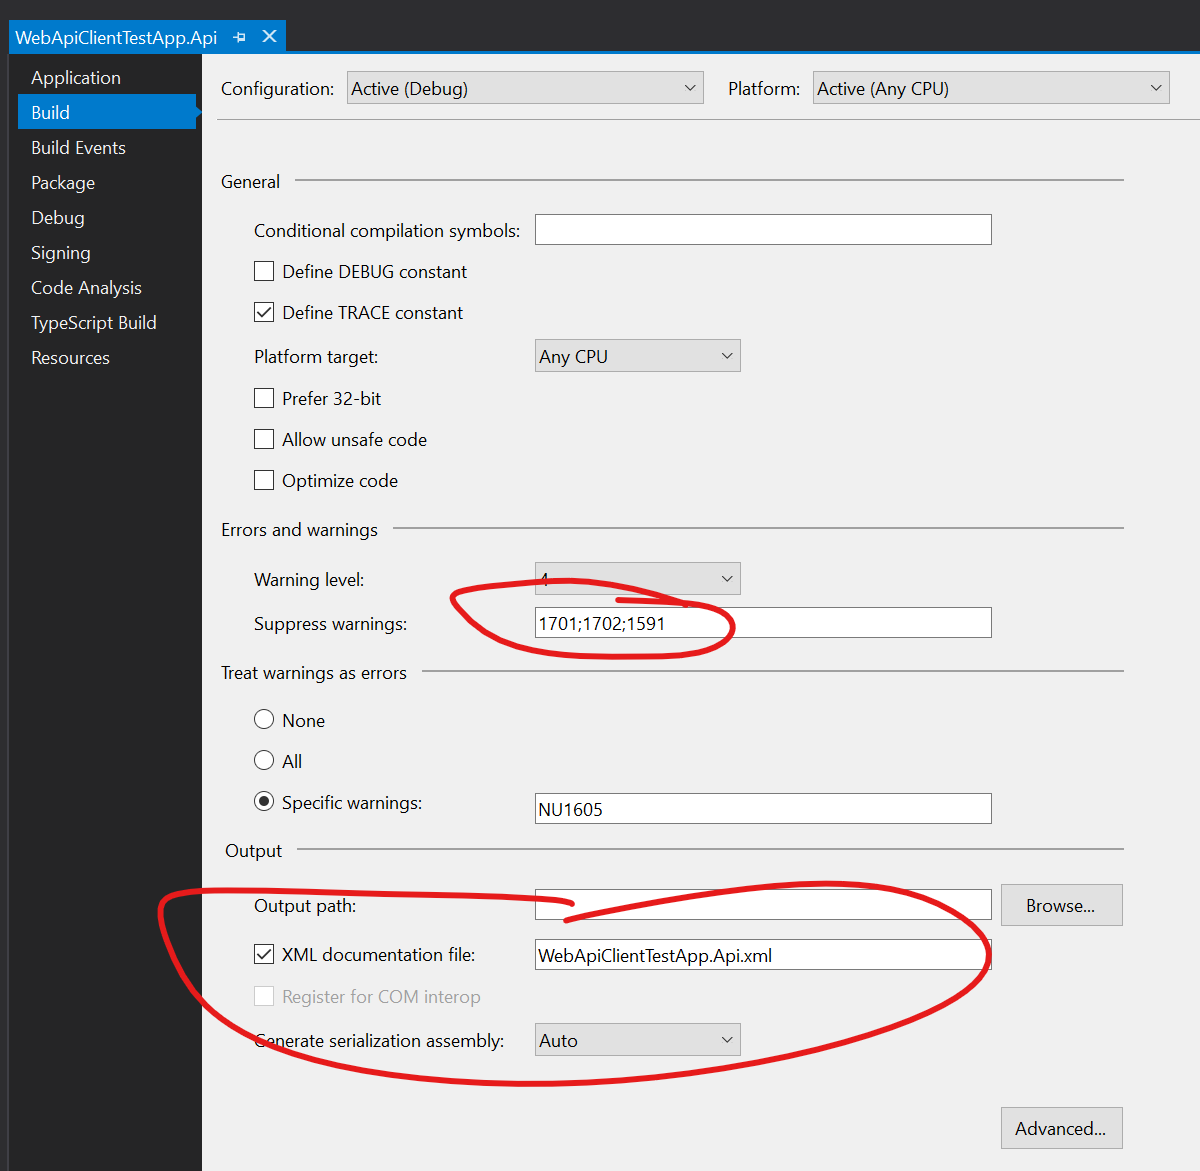
After the path to the XML file to create is given in the XML documentation file field, Visual Studio will start to show warning CS1591 for public methods without an XML comment. This is most likely not the preferred behavior and the warning can be turned off by adding it to the Suppress warnings field as seen in the image above.
After the file is generated then it can be referenced by Swashbuckle in the Swagger setup by using the IncludeXmlComments option. This is an example of how to compose the path to the XML file and supply it to Swashbuckle inside ConfigureServices:
            services.AddSwaggerGen(c =>
            {
                c.SwaggerDoc("v1", new OpenApiInfo { Title = "My API", Version = "v1" });

                // Set the comments path for the Swagger JSON and UI.
                var xmlFile = $"{Assembly.GetExecutingAssembly().GetName().Name}.xml";
                var xmlPath = Path.Combine(_baseFolder, xmlFile);
                c.IncludeXmlComments(xmlPath, includeControllerXmlComments: true);
            });
The field _baseFolder is set like this in the Configure method:
        public void Configure(IApplicationBuilder app, IWebHostEnvironment env)
        {
            _baseFolder = env.ContentRootPath;
            ...
        }
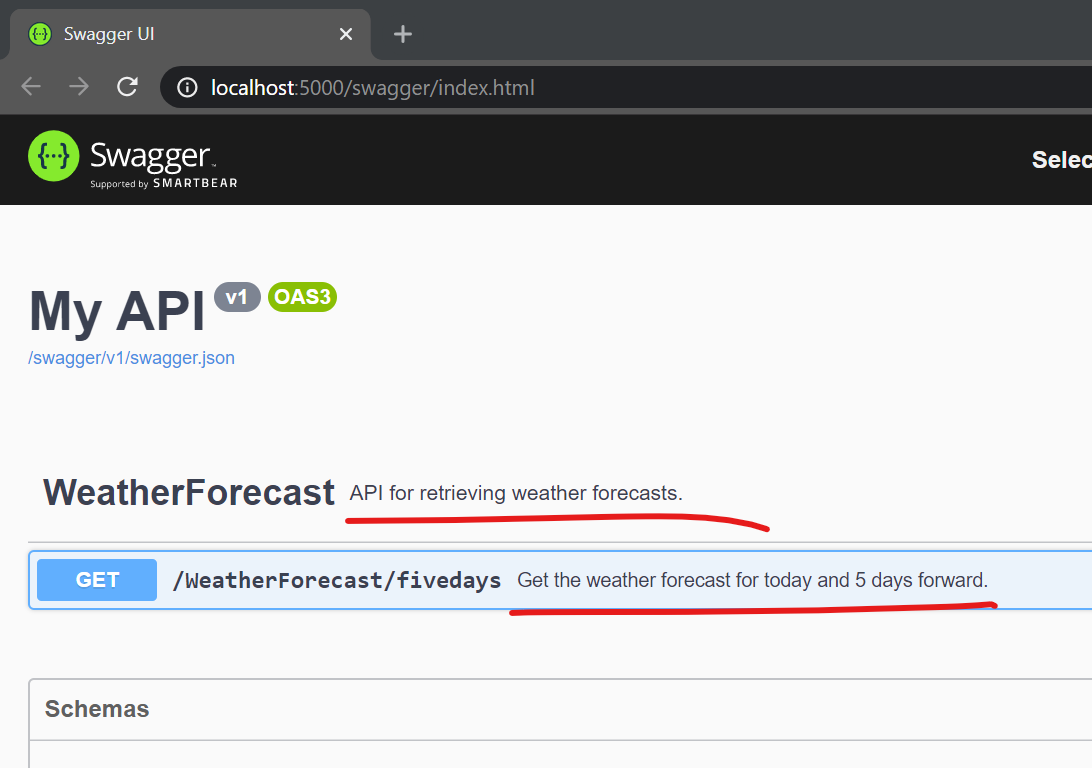
The result should look like this:
Override data types
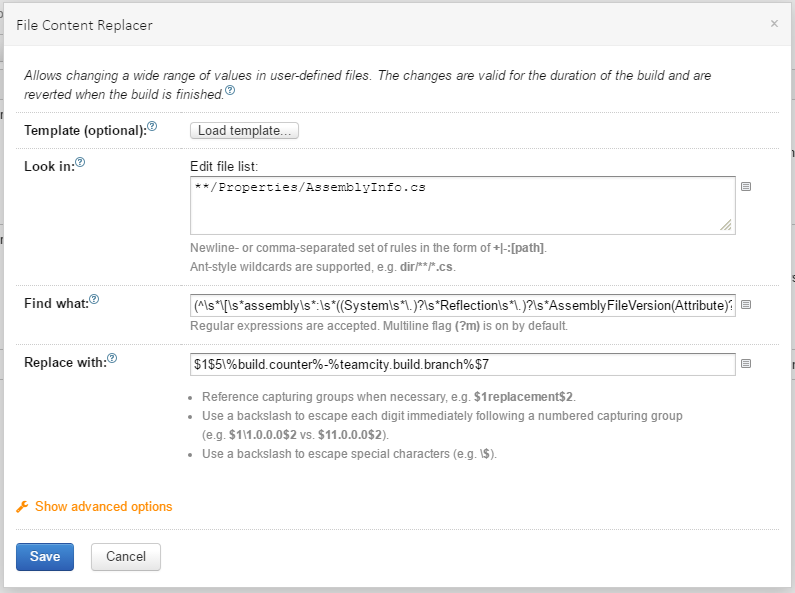
Some data types are not correctly preserved in the service description by default, for example the decimal type found in .Net, which is commonly used in financial applications. This can be fixed by overriding the behavior for those particular types.
This is how to set the options to serialize decimal values correctly in the call to AddSwaggerGen:
                // Mark decimal properties with the "decimal" format so client contracts can be correctly generated.
                c.MapType<decimal>(() => new OpenApiSchema { Type = "number", Format = "decimal" });
                c.MapType<decimal>(() => new OpenApiSchema { Type = "number", Format = "decimal" });
(This fix is from the discussion about a bug report for Swashbuckle.)
Before: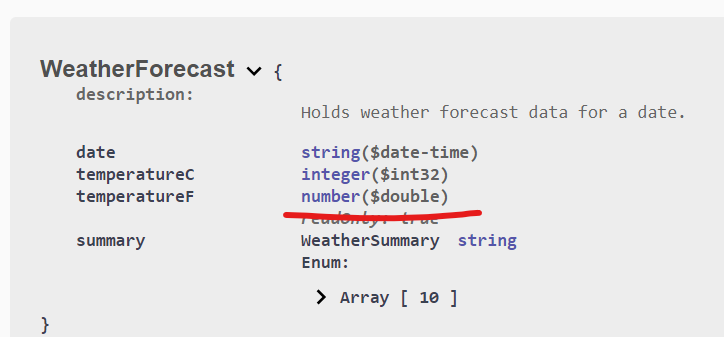
After: 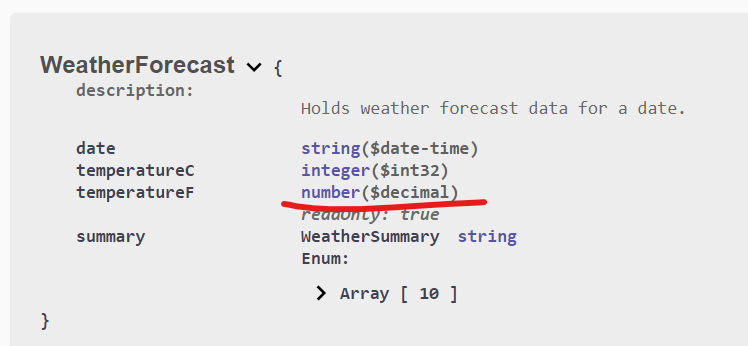
Other service adjustments
In addition to adding and configuring Swashbuckle, there are a couple of other adjustments I like to make when creating services.
Serializing enums as strings
Enums are very useful in .Net when representing a limited number of values such as states, options, modes and similar. In .Net, enum values are normally just disguised integers which is evident in Web Api responses containing enum values, since they are returned as integers with unclear interpretation. Returning integers is not that descriptive so I typically configure my services to return enum values as strings. This is easiest done by setting an option for the API controllers in the ConfigureServices method in the Startup class:
services.AddControllers()
  .AddJsonOptions(options =>
    {
        // Serialize enums as string to be more readable and decrease
        // the risk of incorrect conversion of values.
        options.JsonSerializerOptions.Converters.Add(
            new JsonStringEnumConverter());
        });
Serializing dates as strings without time parts
In the .Net framework there is no data type for dates, so we’re normally relying on the good old DateTime also in cases where the time is irrelevant. This also means that API responses with dates often will contain time parts:
{
    "date": "2020-01-06T00:00:00+01:00",
    "temperatureC": 49,
    "temperatureF": 120,
    "summary": "Warm"
},
This is confusing and may lead to bugs because of the time zone specification part.
To fix this, we can create a Json serializer that extract the date from the DateTime value as described in this StackOverflow discussion.
public class ShortDateConverter : JsonConverter<DateTime>
{
  public override DateTime Read(ref Utf8JsonReader reader, Type typeToConvert, JsonSerializerOptions options)
  {
    return DateTime.Parse(reader.GetString());
  }

  public override void Write(Utf8JsonWriter writer, DateTime value, JsonSerializerOptions options)
  {
    writer.WriteStringValue(value.ToUniversalTime().ToString("yyyy-MM-dd"));
  }
}
The serializer must then be applied on the data contract properties as required:
public class WeatherForecast
{
  [JsonConverter(typeof(ShortDateConverter))]
  public DateTime Date { get; set; }
}
This is the result:
{
    "date": "2020-01-06",
    "temperatureC": 49,
    "temperatureF": 120,
    "summary": "Warm"
},
Much better. 🙂
Returning errors in a separate response type
In case of an error, information about it should be returned in a structured way just as any other content. I sometimes see added fields in the normal response types for error messages and similar but I think this is bad practice since it pullutes the data contracts with (generally) unused properties. It’s much clearer for the client if there is a specific data contract for returning errors, for example something like this:
{
  "errorMessage": "An unhandled error occurred."
}
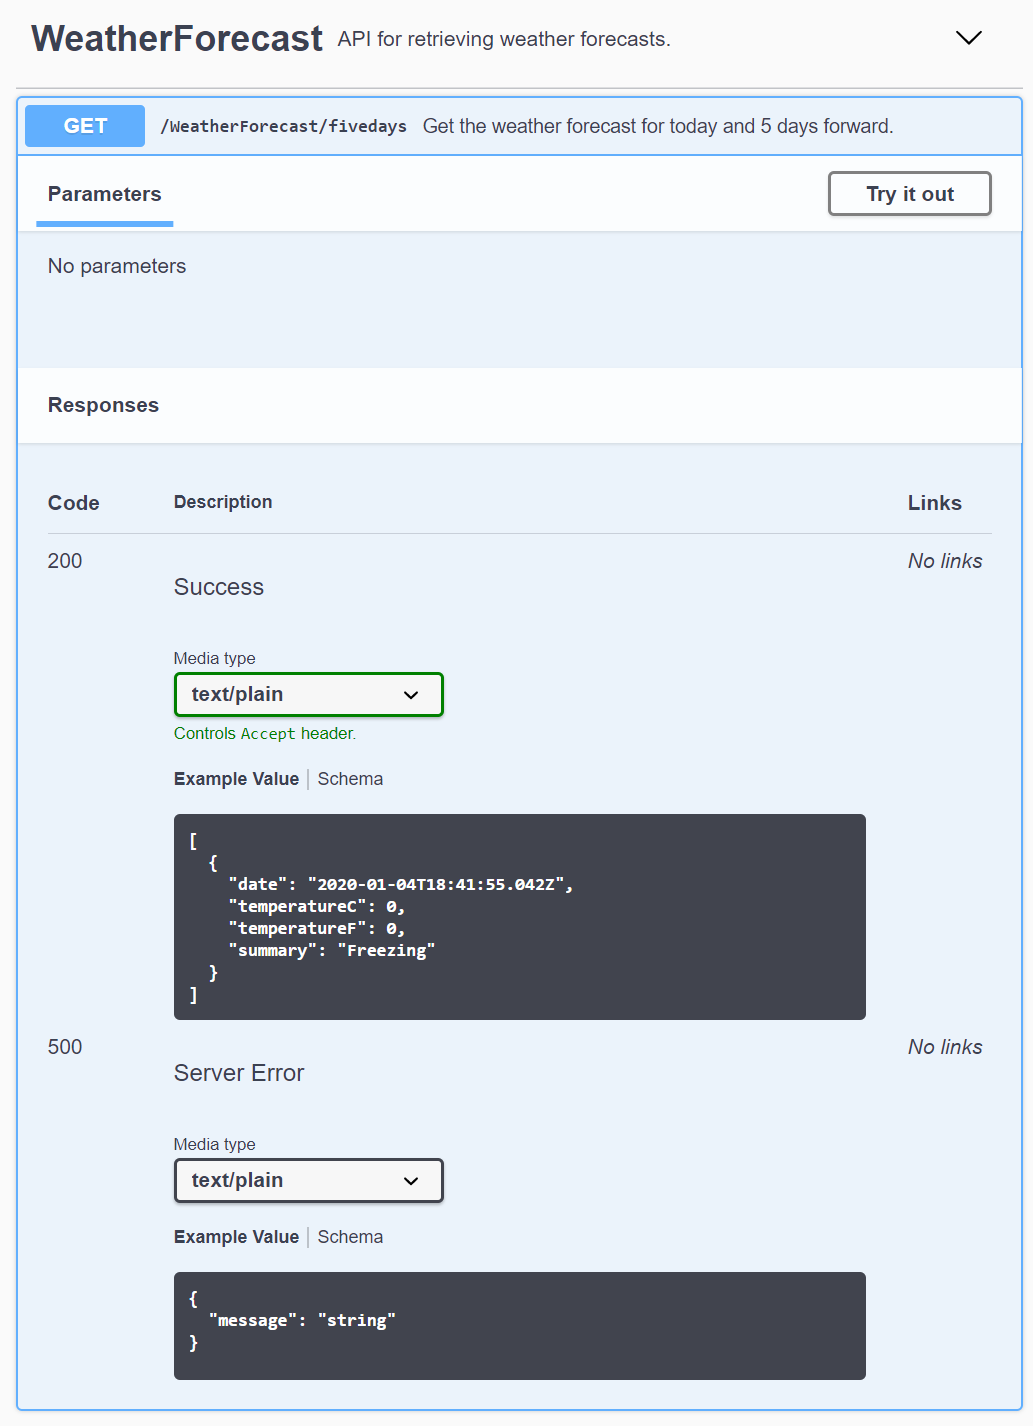
Having separate contracts for normal responses and errors requires controller actions to return different types of values depending on whether there’s an error or not, and that the Swagger service description displays information about all the required types. Luckily Swashbuckle supports this well, as long as the return types are described using the ProducesResponseType attribute.
Here’s a complete controller action where we return different classes depending on if there’s an error or not:
[HttpGet]
[Route("fivedays")]
[ProducesResponseType(
statusCode: (int)HttpStatusCode.OK,
type: typeof(IEnumerable<WeatherForecast>))]
[ProducesResponseType(
statusCode: (int)HttpStatusCode.InternalServerError,
type: typeof(ApiError))]
public ActionResult<IEnumerable<WeatherForecast>> Get()
{
try
{
var rng = new Random();
return Enumerable.Range(1, 5)
.Select(index =&amp;amp;amp;amp;gt; new WeatherForecast
{
Date = DateTime.Now.AddDays(index),
TemperatureC = rng.Next(-20, 55),
Summary = GetRandomSummary(rng)
}).ToArray();
}
catch (Exception ex)
{
_logger.LogError(ex, "Unhandled error");
return StatusCode(
(int)HttpStatusCode.InternalServerError,
new ApiError { Message = "Server error" });
}
}
The Swagger page correctly displays the different data structures used for the different status codes:
Summary
This concludes the first part in this mini-series. We now have a complete Web Api service with the following properties:
- A Swagger description file can be found at /swagger/v1/swagger.json
- A Swagger documentation and testing page can be found at /swagger
- Code comments are included in the service description
- Enums are serialized as strings
- Dates are serializes as short dates, without time part
- Decimal values are correctly describes in the service description
In part 2 we show how we can consume this service in a client.
/Emil
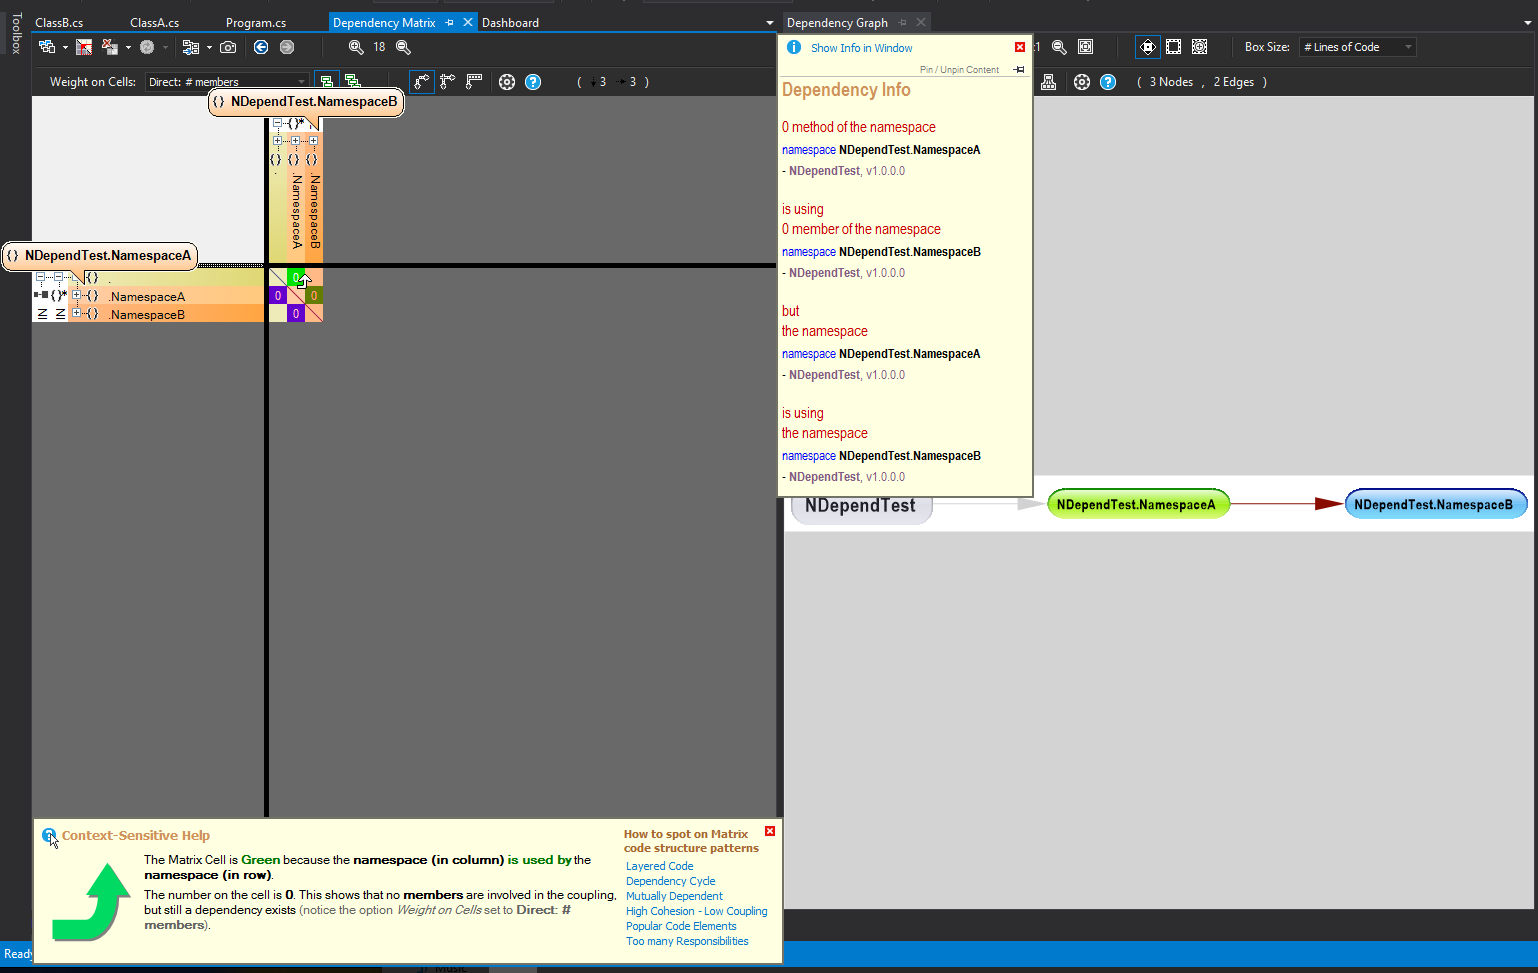
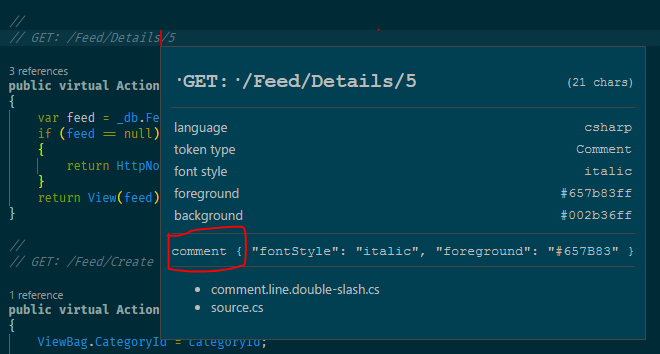 In this case it’s comment. Moving the cursor will update the scope information in the window. Close it with the Esc key.